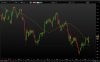
Spot the Bear. Weekly chart analysis of S&P500

Especially common in futures trading, make 20k one month give back 18K the next, sounds improbable after such good gains but remains a reality for some/most. :banghead:
Hope I'm wrong

I wasn't referring to trading b/even is the norm, I merely said that it's OK to be wrong and have losses, the name of the game is to win more than lose, whatever the ratio between the two :)
 
If you guys truly want to protect your assets, just enter on retraces long as long as we are above 50 day MA. It's essentially free money. Pick your points to get long and adjust stop and size to 2% per entry to TP. That is exactly how price is trading.

Eventually if you keep repeating this the market will show you when it doesn't work anymore. That's when risk increases that trend has shifted.

Recent high was around 2012, -30 points = 1982 .. 1982 is the only entry unless it's expands range higher.. Tp is always 30, Sl always 30.

By doing this your tagging entries off the highs as the highs get higher.
 
Last edited:
If you guys truly want to protect your assets, just enter on retraces long as long as we are above 50 day MA. It's essentially free money. Pick your points to get long and adjust stop and size to 2% per entry to TP. That is exactly how price is trading.

Eventually if you keep repeating this the market will show you when it doesn't work anymore. That's when risk increases that trend has shifted.
That would have worked very well recently ! Hope your capitalizing on your strategy
 
That would have worked very well recently ! Hope your capitalizing on your strategy

Instead of trying to predict sides, your basically tracking price wherever it takes you. It will also show you when one side stops working.
 
Instead of trying to predict sides, your basically tracking price wherever it takes you

I don't know all of requirements for this method, but having been around the block few times I doubt that at 1:1 reward to risk this would be a hot stuff. Perhaps you could clarify exact entry formula.
 
Instead of trying to predict sides, your basically tracking price wherever it takes you. It will also show you when one side stops working.
Actually I view the markets in this very way, I use 1 sma to determine trend IE the market makes the decision for me. The trouble comes when price whipsaws but as you said place your stop appropriately and your chances are increased again.
One very strong factor I have realized is to view longer term charts and see really where support and resistance "IS" I know this is an obvious fact but can be all lost in translation when you trade off shorter time frames.
Seems S and R trumps over all other things
DAX S R.png
 
See this is another sign of a likely reversal - bears I know here are throwing in the towel thinking NQ is back to 5k. Look guys, we just need that last hurrah and we're not through with it yet. In all truth you might not even get that total blow off top (just look back in mid-2015 where it was rangeville) - but to just assume it's situation normal and we're headed back to ATH is giving up on the plan too early IMO. Wait until the next week of drama plays out and then go from there. The fundamentals are hideous (I know, I know).

This is true...The market turns on the Monthly Employment Reports or the FOMC meetings...Pretty much ensures that lots of stops get gunned before the market can turn.
 
Back
Top