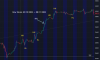
hi,everyone. I am new to technique analysis and learning how to identify major high, major low in chart. Here is an example from my tutorial book that I am confuse. I don’t understand why the white one pointing position is belong to Higher high(major high)? is it related to wave counting? does anyone can give me little help? thank you.
P.S this is 1hr Dow future chart(code: YM1!)
P.S this is 1hr Dow future chart(code: YM1!)
")