it was lucky for the shorts they could not short it,

You are using an out of date browser. It may not display this or other websites correctly.
You should upgrade or use an alternative browser.
You should upgrade or use an alternative browser.
Some guys have all the balls
- Thread starter Pekelo
- Start date
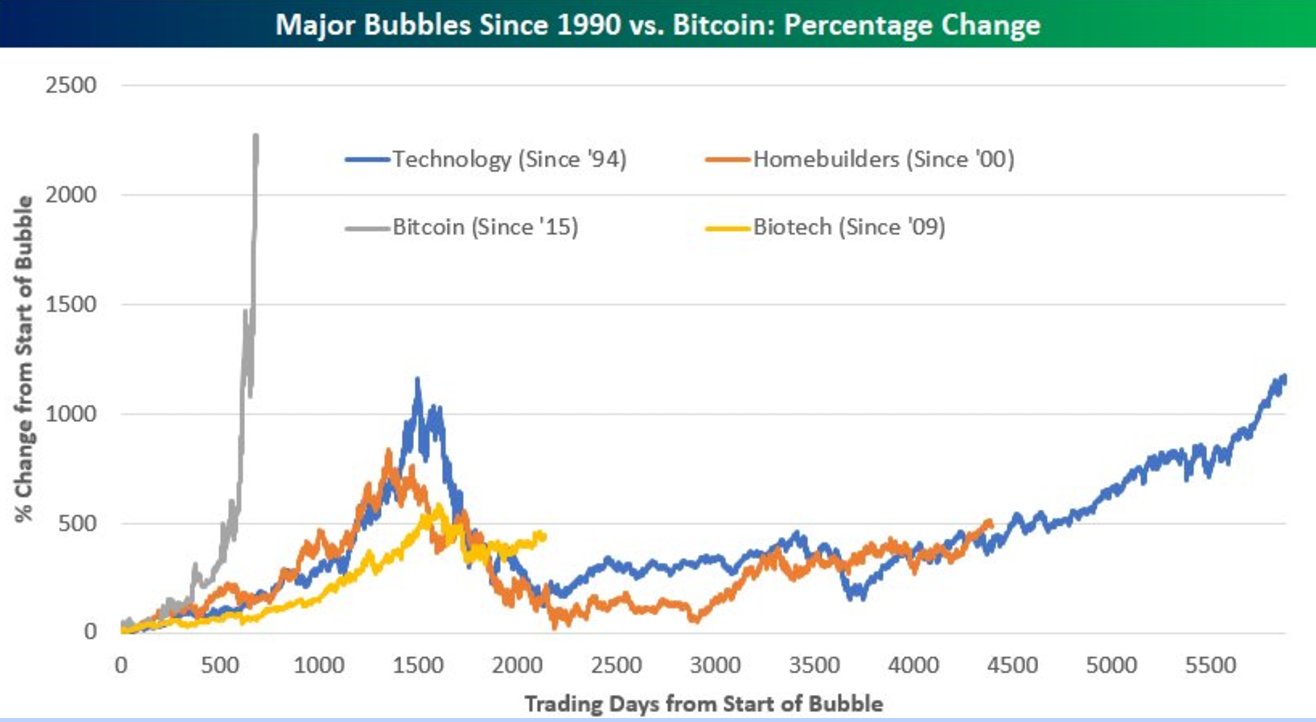


Bitcoin is going to come crashing down.
Nothing in history even remotely looks like that chart -- and has sustained it,

Bet the farm on put options, and clean up...the reward from that will make its rise look like peanut returns,
Last edited:

The thing with bubbles is that people always think they can get out before it bursts.

Yeah. Sorry. It was just something I picked up on twitter.
Do you have any charts? Would love to see a better chart.
Do you have any charts? Would love to see a better chart.
Before I find a good all time chart, here are the bubbles:
https://en.wikipedia.org/wiki/History_of_bitcoin
1. 2011 July top at $31 >> down to $2
2. 2013 April top at $266 >> down to $100
3. 2013 November top at $1242 >> down to $200
4. 2017 August top around $4687 (still going) >> ???
OK, here it is, the first bubble doesn't even show up, because of the later huge increase, but you can see it if you move your cursor over the chart:
https://www.coindesk.com/price/
https://en.wikipedia.org/wiki/History_of_bitcoin
1. 2011 July top at $31 >> down to $2
2. 2013 April top at $266 >> down to $100
3. 2013 November top at $1242 >> down to $200
4. 2017 August top around $4687 (still going) >> ???
OK, here it is, the first bubble doesn't even show up, because of the later huge increase, but you can see it if you move your cursor over the chart:
https://www.coindesk.com/price/
Last edited:
Parabolic!