You are using an out of date browser. It may not display this or other websites correctly.
You should upgrade or use an alternative browser.
You should upgrade or use an alternative browser.
Software to plot options against underlying over time
- Thread starter jtunner
- Start date
Robert Morse
Sponsor
Are you looking to '"view" an estimate of future decay if the index were not to change overtime? How would you benefit from the visual?
You can use the BS model with current assumptions to get option values for each day for that strike. Then put those values in a spreadsheet and you have your plot. I'm sure someone here or in a blog has posted the BS formula that you can use in a spreadsheet. I'm not sure what value it offers as the index never stands still and Ivol always moves.
You can use the BS model with current assumptions to get option values for each day for that strike. Then put those values in a spreadsheet and you have your plot. I'm sure someone here or in a blog has posted the BS formula that you can use in a spreadsheet. I'm not sure what value it offers as the index never stands still and Ivol always moves.
here http://bit.ly/TFFL7VI am looking for software that, given a fixed price for an option (say SPX Puts costing 2.00) will plot the corresponding strike prices for this option over time (preferably on the same chart with the SPX stop price).
Are you looking to '"view" an estimate of future decay if the index were not to change overtime? How would you benefit from the visual?
You can use the BS model with current assumptions to get option values for each day for that strike. Then put those values in a spreadsheet and you have your plot. I'm sure someone here or in a blog has posted the BS formula that you can use in a spreadsheet. I'm not sure what value it offers as the index never stands still and Ivol always moves.
Robert, thanks for the reply and no, what I'm looking for is much simpler:
I would like to visually see how far from the spot price I would have to sell the option in order to receive a 2.00 credit. This could then be plotted against the SPX spot on the same chart. The option price here would be a fixed constant. This would require daily historic data of SPY, SPX or ES options.
JT
Attachments
How about this One
Robert Morse
Sponsor
Robert, thanks for the reply and no, what I'm looking for is much simpler:
I would like to visually see how far from the spot price I would have to sell the option in order to receive a 2.00 credit. This could then be plotted against the SPX spot on the same chart. The option price here would be a fixed constant. This would require daily historic data of SPY, SPX or ES options.
JT
$2.00 for one options or a spread? and, I would never use the SPX cash but the future that corresponds to that option, unless you are very close the expiration.
$2.00 for one options or a spread? and, I would never use the SPX cash but the future that corresponds to that option, unless you are very close the expiration.
In the above I actually meant to write SPY not SPX (which is perhaps the simpler approach), but your point is well taken with regard to forward pricing.
In general, for a unit costing 2.00 expiring in the next month, I would like to plot the chaining strike price over time.

Maybe you should roll your own?
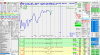
This is from February -- six expiries of SPX data from a .csv scrape, calculated Gaussian P(ITM)s in front of market-declared deltas, and then calculated $5-$20 wide vertical spreads. Lastly, these spreads are filtered for some price range.
The stated wish for a $2.00 option price would be that much simpler, but this illustrates a bunch of market/environment factors that I think you're aiming at.
(A little math between cells G11 and M11 suggests this was printed at 16:00 14Feb'18, FYI. The vol (26 and 24.xx) barely fits on the page!)
Maybe you should roll your own?
This is from February -- six expiries of SPX data from a .csv scrape, calculated Gaussian P(ITM)s in front of market-declared deltas, and then calculated $5-$20 wide vertical spreads. Lastly, these spreads are filtered for some price range.
The stated wish for a $2.00 option price would be that much simpler, but this illustrates a bunch of market/environment factors that I think you're aiming at.
(A little math between cells G11 and M11 suggests this was printed at 16:00 14Feb'18, FYI. The vol (26 and 24.xx) barely fits on the page!)
View attachment 186768
The point is, there does not seem to be stuff out there to actually *use* in active trading, for the retail or smaller-fund world. The large guys ain't sharing, and there does not appear to be a viable market for a retail-level product to actually get paid. (There is a guy in Australia -- Hoadley:
https://www.hoadley.net/options/options.htm
who's stuff is just marvelous. "SOTA" and all that. Been around forever. But who's heard of him?
In IB-land, there is this guy:
http://www.tradingsoftwarelab.com/
who is an ET member, been an IB add-on provider for many years, gets respect from IB customer reviews..... But why don't we hear more or see more from him?
Dunno.
But if you don't see what you want, DO go roll your own. LOTS of benes from the effort.