You are using an out of date browser. It may not display this or other websites correctly.
You should upgrade or use an alternative browser.
You should upgrade or use an alternative browser.
Software for charting spreads/ synthetics with more than 2 legs ?
- Thread starter CALLumbus
- Start date


Find a vendor that supplies data for exchange supported spreads.
There is GREAT danger and misinformation with respect to charting spread expressions synthetically ( a charted spread expression where each leg is written as the individual month/year code or individual flat price product code ) unless all of the instruments trade at simultaneous frequencies and without co integration lags. In other words, parallel liquidity amongst instruments is mandatory within seconds or you are charting a MIRAGE.
A quick look at an exchange supported spread order DOM next to the individual flat price order DOMs, or Bloomberg Time and Sales data comparison will validate my point.
There is GREAT danger and misinformation with respect to charting spread expressions synthetically ( a charted spread expression where each leg is written as the individual month/year code or individual flat price product code ) unless all of the instruments trade at simultaneous frequencies and without co integration lags. In other words, parallel liquidity amongst instruments is mandatory within seconds or you are charting a MIRAGE.
A quick look at an exchange supported spread order DOM next to the individual flat price order DOMs, or Bloomberg Time and Sales data comparison will validate my point.
Last edited:

Find a vendor that supplies data for exchange supported spreads.
Yep, this is one of the reasons I was considering opening an account with DDT to trade spreads with CQG QTrader so I'd actually have charts resembling reality rather than a mathematical derivation (which I don't think is totally useless, but not nearly as useful as the actual trades).
@ i969,
I played around some more with SC, and here is something that might help you:
For basic spreads between 2 instruments, you can use the "difference study" (bar or single line), just like you did in your examples.
For spreads with 3 legs/ instruments, you can use the "spread- 3 chart study":
This study uses 3 charts and creates a price bar graph. The formula is: Chart 1 + Chart 2 - Chart 3. I tried it and it works great.
For flies (like the Bund/Bobl/Schatz fly) you can use the "spread- butterfly study":
This study uses 3 charts and creates a price bar graph. The default formula is: Chart 1 - (Chart 2 * 2) + Chart 3. I tried this too and it works just fine.
I hope that these additional studies save you some time and trouble in creating the charts you need.
I played around some more with SC, and here is something that might help you:
For basic spreads between 2 instruments, you can use the "difference study" (bar or single line), just like you did in your examples.
For spreads with 3 legs/ instruments, you can use the "spread- 3 chart study":
This study uses 3 charts and creates a price bar graph. The formula is: Chart 1 + Chart 2 - Chart 3. I tried it and it works great.
For flies (like the Bund/Bobl/Schatz fly) you can use the "spread- butterfly study":
This study uses 3 charts and creates a price bar graph. The default formula is: Chart 1 - (Chart 2 * 2) + Chart 3. I tried this too and it works just fine.
I hope that these additional studies save you some time and trouble in creating the charts you need.

I trade exchange traded spreads on Qtrader. Intraday, I often see the spread price as 1 -2 ticks off on pricing based on the individual legs.
I am not sure if this is simply due to the range expansion in the bid/ask. But in any case, an autospreader might not be enough to profits for a non-member when 50% of profits go to commissions after batting 99%.
I am not sure if this is simply due to the range expansion in the bid/ask. But in any case, an autospreader might not be enough to profits for a non-member when 50% of profits go to commissions after batting 99%.
I trade exchange traded spreads on Qtrader. Intraday, I often see the spread price as 1 -2 ticks off on pricing based on the individual legs.
I am not sure if this is simply due to the range expansion in the bid/ask. But in any case, an autospreader might not be enough to profits for a non-member when 50% of profits go to commissions after batting 99%.
It's the bid / ask spread. You will almost never be able to buy a bid in one product and sell an offer in another product using an Auto Spreader. In order to get filled using an Auto Spreader and actually even an exchange traded spread, the market will have to trade through you, if even from a moment.
One appealing aspect of the exchange spread is that you do not have to worry about an exchange's message-to-fill ratio policy, or getting hung by the Auto Spreader.
There is GREAT danger and misinformation with respect to charting spread expressions synthetically ( a charted spread expression where each leg is written as the individual month/year code or individual flat price product code ) unless all of the instruments trade at simultaneous frequencies and without co integration lags. In other words, parallel liquidity amongst instruments is mandatory within seconds or you are charting a MIRAGE.
As Bone stated above, charting a synthetic spread created from the underlying legs is not as simple as comparing the last traded price of one leg to the others or using one-minute bar data to compute the spread prices. To prevent from “charting a mirage” as Bone stated, here at Trading Technologies (TT) we have gone out of our way to provide a better spread chart. We capture all best bid-ask market moves and traded prices, such that we look at one leg’s best bid or ask price when a trade occurs on the other leg’s bid or ask.
The above method creates an excellent synthetic spread chart and we support up to 10-leg spreads. The nice thing about TT, is once you create the spread for trading, there is no additional work to create the spread chart. You can request the synthetic instrument and add studies and drawing tools just like a regular instrument in the chart.
Our bid-to-bid/ask-to-ask spread charts will calculate a spread price whenever there is a trade on one leg. If the trade occurs on the bid of leg one, then we will look at the bid of the other legs if they are required to sell and the ask if they are required to buy to determine the spread price. This effectively acts as getting edge on one leg with a limit fill and the other legs going to market to complete the spread.
Below are some screenshots showing the difference between using exchange traded spreads and synthetic spread charts. One thing that stands out is as long as there is one leg in your spread that has liquidity, the synthetic chart will have more data and be able to provide the trader with more information as to how the spread moves. (Some exchange traded spreads have so little liquidity that a move can occur, but if no trade occurs the movement is not displayed in a chart of the exchange traded spread.)

Below is a screenshot of a comparison chart between a synthetic spread and an exchange traded spread. We are currently working on adding comparison charts in the next-gen TT platform over the next two months. (TT is not only the acronym for Trading Technologies, it is also the name of our new platform.) Soon we will take spread charts even further by allowing for additional spread chart options like charting mid-to-mid prices of the spread.

Esignal of course will chart exchange traded spreads. Taking the crude oil August butterfly as an example you can either chart it as a custom synthetic spread or more precisely using the exchange traded spread.
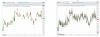
As Bone pointed out if you chart the synthetic spread symbol: CL Q5:CLU5 - CL U5:CLV5 in esignal you will get mirage prints where price didnt actually trade. See chart attached on left in the last week it would lead you to believe that -0.06 and +0.04 are the range extremes. Of course price didnt actually ever trade there.
If you chart the exchange traded symbol CL Q5BF:CLU5:CLV5 in esignal you only see the actual trades. See chart attached on left actual range was -0.05 to -0.02.
I find queue position is respected and price does not necessarily need to trade through me to get filled although it often will by nature of the price swing. If you have a resting order for several days away from inside spread when it comes to your price queue position is respected as it should be.
Esignal on demand is good value at $55pm, 10 minutes delayed data is fine if you are holding for days and you have the live price with your broker. Of course you can pay for a more expensive front end but $600pm or whatever it is 7.2% of a $100k account over the course of a year. That's a big headwind for retail traders.
GL.
As Bone pointed out if you chart the synthetic spread symbol: CL Q5:CLU5 - CL U5:CLV5 in esignal you will get mirage prints where price didnt actually trade. See chart attached on left in the last week it would lead you to believe that -0.06 and +0.04 are the range extremes. Of course price didnt actually ever trade there.
If you chart the exchange traded symbol CL Q5BF:CLU5:CLV5 in esignal you only see the actual trades. See chart attached on left actual range was -0.05 to -0.02.
I find queue position is respected and price does not necessarily need to trade through me to get filled although it often will by nature of the price swing. If you have a resting order for several days away from inside spread when it comes to your price queue position is respected as it should be.
Esignal on demand is good value at $55pm, 10 minutes delayed data is fine if you are holding for days and you have the live price with your broker. Of course you can pay for a more expensive front end but $600pm or whatever it is 7.2% of a $100k account over the course of a year. That's a big headwind for retail traders.
GL.