
It is quite easy to predict the longterm movements of stocks using the smoothness trend method
Hoow it works is by taking a chart and converting it long term-linear scale so you can easily filterout trends that will continue and weed out those that will falter.
IN short:
1. The more 'smooth' a chart is for a long timeframe, the more likely the prevailing trend will continue. The 'smoothness' is determined using various functions.
You can also use the smoothness method to draw VERY accurate trendlines.
Predicting Google was a nobrainer using the smoothness method..I made a fortune
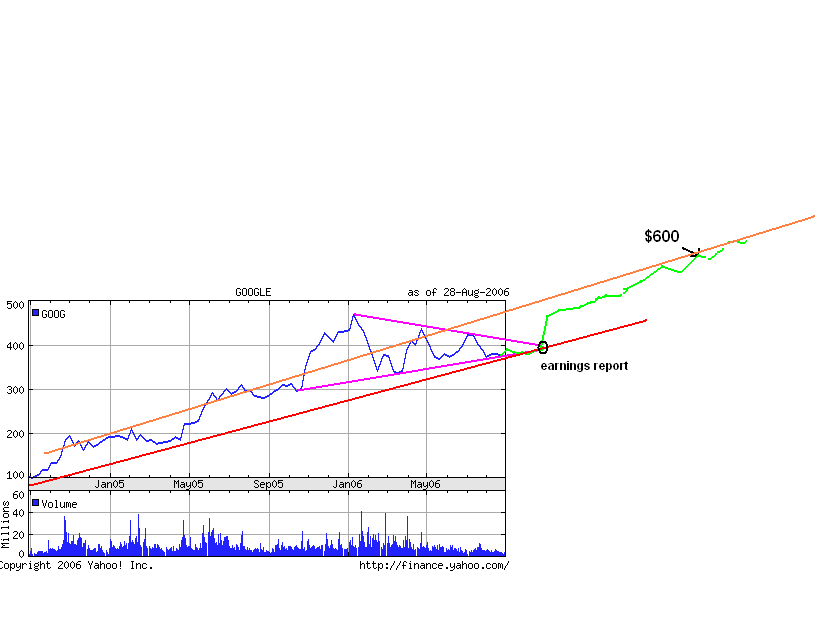
The chart below shows my prediction of google using this method 1.5 months before the MASSIVE earnings pop
As you can see, the chart was VERY smooth and still is.
So easy to make moeny using this method. Why am I telling you? I dunno.
Hoow it works is by taking a chart and converting it long term-linear scale so you can easily filterout trends that will continue and weed out those that will falter.
IN short:
1. The more 'smooth' a chart is for a long timeframe, the more likely the prevailing trend will continue. The 'smoothness' is determined using various functions.
You can also use the smoothness method to draw VERY accurate trendlines.
Predicting Google was a nobrainer using the smoothness method..I made a fortune
The chart below shows my prediction of google using this method 1.5 months before the MASSIVE earnings pop
As you can see, the chart was VERY smooth and still is.
So easy to make moeny using this method. Why am I telling you? I dunno.