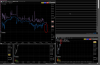
This is probably stating the obvious but I am wondering if the microstructure experts could share some insight. Attached is a recent tick chart on a deep OTM SPY put. The bid tends to rapidly drop below the midpoint before a move higher in the underlying, and the ask tends to rapidly rise above the mid before a move lower in the underlying. This is transient and the spread almost instantly reverts to the mean. TWS API doesn't provide data at a sufficiently high resolution to capture the change, so this is only empirical.
Skewed bid/ask spread on options before change in the underlying spot price
- Thread starter ensemble
- Start date