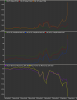
Hi - I was messing around with some ATM IV values (constant maturity - from iVolatility's IV Graph) and came across a menu option for "Skew by Moneyness." Although I understand the individual terms, I wasn't familiar with this type of data representation, so I Googled it. I came across a two or three year old article by one of the authors/traders behind "Expiring Monthly" magazine and he said IV Graph's "Skew by Moneyness" was not very common in the industry.
So, is iVolatility ahead of their time or did the options analysis industry decide long ago that this was a measure that didn't add much value?
FYI, it's the chart at the bottom in purple and yellow. It looks like they subtract the IV for a strike 10% above ATM from a strike 10% below ATM, and since we're at an extreme in NG call skew right now, the value shows as a negative.
So, is iVolatility ahead of their time or did the options analysis industry decide long ago that this was a measure that didn't add much value?
FYI, it's the chart at the bottom in purple and yellow. It looks like they subtract the IV for a strike 10% above ATM from a strike 10% below ATM, and since we're at an extreme in NG call skew right now, the value shows as a negative.