This thread is the result of reading iamnewuser911's thread:
' I have tried everything and nothing works (Technical analysis) '
Discussion in 'Forex' started by iamnewuser911, Nov 6, 2016
What's needed is something that gives a Buy/Sell signal.
The T3 or Tilson Indicator gives a 'signal' by changing color when the price changes from
Up to Down, Down to Up.
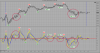
Attached is a NinjaTrader 1min chart, the Opening + about 3 hours from the Wed Nov 23
ES session, the last full trading day of last week.
Instrument: E-mini S&P 500 Index ~ ES ~ CME/Globex ~ $50 x Index Value ~ H,M,U,Z ~ 0.25 / $12.50
DayTrading Margin: US$400 ( $800 during US Election count ) OverNight Margin: $4,750.00
see: http://www.ampfutures.com/trading-info/margins/
RoundTurn Commission: $3:52 ( ? ) per Contract
NinjaTrader with CQG feed, free unlimited demo and live, Version 7 . NB: V 8 won't have 'custom'
Indicators converted from V 7.
Broker: http://www.ampfutures.com/
Blue dotted vertical line is the 9:30/6:30am NY Open
vertical lines are 5 min intervals
horizontal lines are 1 Point apart ~ $50 , 4 ticks to a point, 1 tick = $12.50
White line on the Price is a SMA 1 C
Yellow and Blue line is the NinjaTrader T3 Colored
settings: Paint Bars: True . Period: 3 . TCount: 3 . VFactor: 1 .
The T3 colors are set to match the GMACD: Parameters are 4 3 3 8 4 8 4 7 3 but
not necessarily optimized to the 1min chart.

The trading technique is to ONLY enter a trade when the GMACD is at an EXTREME, Closing
the trade when the trend expires, indicated by a new, opposite GMACD Extreme signal.
As seen on the chart, GMACD 'signals' aren't 'Absolutes', except perhaps at Extremes.
The T3 Colored tho, attached as it is to the Price, is Absolute, and one might ask —
"what's the point of using the GMACD then ?" — You'll have to answer that yourself ; )
The ES is the most liquid market in the world. Instant and I do mean instant fills and
fills can be at or 1 tick of Mkt Price. 1,000 and more contract orders don't usually cause
any spike or spread in price, at least during RTH.
Using the 'Basic Entry' order entry utility, clicking the ''REV' button will instantly Close the
current order and immediately Open the same position but in the opposite direction, fastest
means of Order Entry. REV; REV; REV; not recommended REVREVREVREVREVREVREV
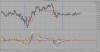
One trading method is to 'trade for 1 point per day'.
As seen on the chart the Price is often more generous and several points can - theoretically
be obtained in 20 minutes or so.
Every 8 points of profit after commissions means that the number of contracts being traded
can be doubled ~ 8 points @ $50 per point = $400 = margin per contract, so,
1 poi nt x 1 contract = $50 , or x 10 contracts = $500 , or x 100 contracts = $5,000 and so on
so the p o t e n t i a l Daily, Weekly, Monthly profit can become substantial. Happy Trading.
' I have tried everything and nothing works (Technical analysis) '
Discussion in 'Forex' started by iamnewuser911, Nov 6, 2016
What's needed is something that gives a Buy/Sell signal.
The T3 or Tilson Indicator gives a 'signal' by changing color when the price changes from
Up to Down, Down to Up.
Attached is a NinjaTrader 1min chart, the Opening + about 3 hours from the Wed Nov 23
ES session, the last full trading day of last week.
Instrument: E-mini S&P 500 Index ~ ES ~ CME/Globex ~ $50 x Index Value ~ H,M,U,Z ~ 0.25 / $12.50
DayTrading Margin: US$400 ( $800 during US Election count ) OverNight Margin: $4,750.00
see: http://www.ampfutures.com/trading-info/margins/
RoundTurn Commission: $3:52 ( ? ) per Contract
NinjaTrader with CQG feed, free unlimited demo and live, Version 7 . NB: V 8 won't have 'custom'
Indicators converted from V 7.
Broker: http://www.ampfutures.com/
Blue dotted vertical line is the 9:30/6:30am NY Open
vertical lines are 5 min intervals
horizontal lines are 1 Point apart ~ $50 , 4 ticks to a point, 1 tick = $12.50
White line on the Price is a SMA 1 C
Yellow and Blue line is the NinjaTrader T3 Colored
settings: Paint Bars: True . Period: 3 . TCount: 3 . VFactor: 1 .
The T3 colors are set to match the GMACD: Parameters are 4 3 3 8 4 8 4 7 3 but
not necessarily optimized to the 1min chart.
The trading technique is to ONLY enter a trade when the GMACD is at an EXTREME, Closing
the trade when the trend expires, indicated by a new, opposite GMACD Extreme signal.
As seen on the chart, GMACD 'signals' aren't 'Absolutes', except perhaps at Extremes.
The T3 Colored tho, attached as it is to the Price, is Absolute, and one might ask —
"what's the point of using the GMACD then ?" — You'll have to answer that yourself ; )
The ES is the most liquid market in the world. Instant and I do mean instant fills and
fills can be at or 1 tick of Mkt Price. 1,000 and more contract orders don't usually cause
any spike or spread in price, at least during RTH.
Using the 'Basic Entry' order entry utility, clicking the ''REV' button will instantly Close the
current order and immediately Open the same position but in the opposite direction, fastest
means of Order Entry. REV; REV; REV; not recommended REVREVREVREVREVREVREV
One trading method is to 'trade for 1 point per day'.
As seen on the chart the Price is often more generous and several points can - theoretically
be obtained in 20 minutes or so.
Every 8 points of profit after commissions means that the number of contracts being traded
can be doubled ~ 8 points @ $50 per point = $400 = margin per contract, so,
1 poi nt x 1 contract = $50 , or x 10 contracts = $500 , or x 100 contracts = $5,000 and so on
so the p o t e n t i a l Daily, Weekly, Monthly profit can become substantial. Happy Trading.