Intellectually I understand what you're doing. But my brain screams overfit. I assume you are doing cross-validation but I haven't heard anything about that in this thread yet though my apologies if I missed it.
Can you please describe what you mean by overfitting? I think I understand but want to make sure that I get it right.
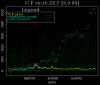
When I think of overfitting, I think of an absurdedly narrow "signal" window, with a very small sample size. Something like this:
The signal is a narrow range of the 200-day MA of the USD. A small number of trades, concentrated on a few lucky spikes in VIX. Seems to me that this strategy probably was just a lucky one, since I'm scanning thousands of potential strategies.
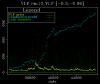
I'm actually not doing any cross-validation. Half because I'm lazy. ;-) Half because I think I can visually observe stationarity in the profit curve. Here's a profit curve that looks much better: over 1000 historical trades and reasonable performance in all market conditions.
As a measure of stationarity, I actually compute the variance of the profit about a straight line connecting t=0,p=0 to t=tmax,p=p(tmax) and use it in the strategy screening process. In other words, if the profit curve is "blocky" or has lots of drawdowns, it will be penalized relative to a nice steady-marching profit curve.