First post to this board. And probably the last! I have done some data mining and analysis to develop rules-based systems for several "uncorrelated" ETFs. I'm going to describe my methods and seek critical feedback from other posters. (Famous words from a one-time poster?)
I code in Fortran 90 (the guts) and perl (high-level processing), and also use open-source signal processing software.
I'm only trading once per day, and I execute the trades manually (in Robinhood). I'm trading ETFs, not options or futures.
I'm using a past "states" to predict the future behavior of the target security. The past states could be 30-day past S&P return, VIX over or under 200 d MA, etc.
For each predictor, say 30-day past S&P return, I loop over all possible states (e.g., 0-3%, 3-6%, etc.) and backtest the target security. This generates a report:
I compute a variety of metrics for each backtested strategy. Most (the ones with the XXXX's) can be discarded immediately, if they lose money, have insufficient trades, insufficient profit/trade, etc.
After aggregating "adjacent" strategies from the report, I produce a master report of all the accepted strategies (usually about 200), which I insert into a spreadsheet and rank using cutoffs. In this case, I settled on the 6 best strategies, which I test daily, and buy if the "signal" hits.

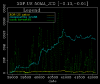
Here's what the daily analysis looks like for one strategy. I'm trading UPRO and the signal is when a consumer confidence has had a crossover of its 200-day MA in the past 30 days. The backtest shows me when signals were received. If I have a signal since yesterday, I trade. The green dots show cash in the market (often, in the past, this strategy had NO cash in the market)

I've only been trading for a month, far too soon to know if I've got something. The combined strategies seem to perform well in backtesting. Here's the combination of 5 trading strategies for XOP, backtested for ~9 years. I'm able to follow the major upswings. I'm not heavily invested during the big downturns. In sideways markets, I'm not heavily invested, but seem to cherrypick the secular increases.

Thus far, I don't optimize position sizing, nor the exit timing. I simply hold the target security for 30 days, unless it stops out.
I code in Fortran 90 (the guts) and perl (high-level processing), and also use open-source signal processing software.
I'm only trading once per day, and I execute the trades manually (in Robinhood). I'm trading ETFs, not options or futures.
I'm using a past "states" to predict the future behavior of the target security. The past states could be 30-day past S&P return, VIX over or under 200 d MA, etc.
For each predictor, say 30-day past S&P return, I loop over all possible states (e.g., 0-3%, 3-6%, etc.) and backtest the target security. This generates a report:
avg return
security lwr upr #trade profit cash ratio power PPT
XXXXXXXXXX -0.370 -0.340 3 313.00 1.22 255.97 80119.24 104.33
XXXXXXXXXX -0.340 -0.310 8 -144.75 3.13 -46.24 6693.51 -18.09
XXXXXXXXXX -0.310 -0.280 4 -192.25 1.49 -129.02 24803.41 -48.06
XXXXXXXXXX -0.280 -0.250 4 -197.50 1.68 -117.63 23232.66 -49.38
XXXXXXXXXX -0.250 -0.220 9 -159.25 4.48 -35.51 5655.05 -17.69
rm30_ES.F -0.220 -0.190 14 356.50 17.68 20.16 7188.03 25.46
rm30_ES.F -0.190 -0.160 37 962.45 72.32 13.31 12809.16 26.01
XXXXXXXXXX -0.160 -0.130 46 211.00 89.96 2.35 494.92 4.59
XXXXXXXXXX -0.130 -0.100 79 -67.75 215.26 -0.31 21.32 -0.86
XXXXXXXXXX -0.100 -0.070 136 -226.67 364.57 -0.62 140.93 -1.67
I compute a variety of metrics for each backtested strategy. Most (the ones with the XXXX's) can be discarded immediately, if they lose money, have insufficient trades, insufficient profit/trade, etc.
After aggregating "adjacent" strategies from the report, I produce a master report of all the accepted strategies (usually about 200), which I insert into a spreadsheet and rank using cutoffs. In this case, I settled on the 6 best strategies, which I test daily, and buy if the "signal" hits.
Here's what the daily analysis looks like for one strategy. I'm trading UPRO and the signal is when a consumer confidence has had a crossover of its 200-day MA in the past 30 days. The backtest shows me when signals were received. If I have a signal since yesterday, I trade. The green dots show cash in the market (often, in the past, this strategy had NO cash in the market)
I've only been trading for a month, far too soon to know if I've got something. The combined strategies seem to perform well in backtesting. Here's the combination of 5 trading strategies for XOP, backtested for ~9 years. I'm able to follow the major upswings. I'm not heavily invested during the big downturns. In sideways markets, I'm not heavily invested, but seem to cherrypick the secular increases.
Thus far, I don't optimize position sizing, nor the exit timing. I simply hold the target security for 30 days, unless it stops out.