You are using an out of date browser. It may not display this or other websites correctly.
You should upgrade or use an alternative browser.
You should upgrade or use an alternative browser.
Sector ETF Leaders
- Thread starter Sigue!
- Start date
Nothing quite that specific that I can put my fingers on, but there is quite a bit of research similar to the paper that I've attached that supports the general premise. See what you think.
Attachments
Maybe this, not sure tho :
https://www.elitetrader.com/et/threads/industry-returns-the-decades-winners-losers.346782/


%%
Most all or many of tech sector etfs were, as of yesterdays close.
Tech is still ranking high, so I've included it in my sector ranking, but I've omitted any tech subsector/industry funds from my consideration. It is the only sector that I did any selling in at the end of the day on Friday. Did some buying in the morning elsewhere. It'll probably be a little more challenging in the weeks to come than it has been for the past few months. Ya think?
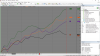
That's VIS hiding behind VOX and VTI at the lower end of the y axis, btw.


That's VIS hiding behind VOX and VTI at the lower end of the y axis, btw.