Got it. Yeah I just mislabeled it, I found myself almost going into automatic mode just putting them on there. I would assume I am moving on to drill 3: (questions are marked with ***)
"write XB to label the translation long on your work sheet
XR is the short transaltion
SYM is the internal where the second bar is inside the first bar
Flat tops and flat biootms are smple to find and name
A hitch is equal volatility sids by sids bars
1.. For all internals, draw the resulting bar second leg by using a red or black ball point
***(so on SYM's the 2 would be the direction of the breakout?)***
2. Use black or Red majic markers to make trend segments of all black or all red second leg bars. This is a zig zag chart.
***(the 2nd leg bars would be the xb's and xr's? and they get marked by black/red lines respectively?)***
3. calculate all the price change of all segements for each day.
***(not sure on this one? perhaps counting in points the 'legs' of each up/down move?)***
4. Add the price shanges to find the full offer of the market for each day.
5 post the 5 day rsults as dates and full offers so you can compare with others."
***(full offers would be the maximum draw you could get if you traded low-high-low-high-low-etc-etc? or is this the full offer as in the draw you could take if you went Long XB, Short XR, Long Flat Top BO, Short Flat Bottom BO, Long/short on the lateral?)***
Please let me know if I am being unclear.
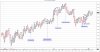
![[11-7] XB IBGS.png](/et/data/attachments/128/128399-a09b87a942d65a389941fd86d44e80bc.jpg?hash=oJuHqULWWj)