
You are using an out of date browser. It may not display this or other websites correctly.
You should upgrade or use an alternative browser.
You should upgrade or use an alternative browser.
"Science" is nothing more than a marketing tool for those pushing an agenda
- Thread starter gwb-trading
- Start date

Just disregard the above for it is written by an AEI person. By the way:
99 Percent Chance 2016 Will Be the Hottest Year on Record
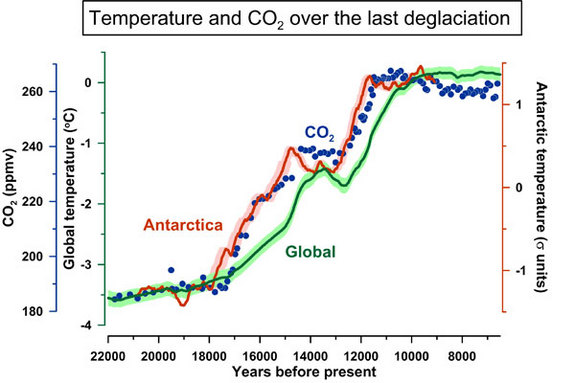
There's a bunch of words, sentences and paragraphs but let's go to the graph:

All that cooling!!
Good, there are 100s of millions of acres that cannot be farmed because it is too cold. This should make for a plentiful harvest. Hopefully the trend continues because climate change has been very kind to humans.
According to that chart it took about 5000 years for CO2 to rise from 180 ppm to 260 ppm.
comparing proxies with instrument data? Bubbles in ice vs air samples on the side of a volcano in HI... there could a little lost in translation.
your possible mistake is understandable.
The hockey stick guys make the same mistake on purpose... with plants and trees instead of ice.
comparing proxies with instrument data? Bubbles in ice vs air samples on the side of a volcano in HI... there could a little lost in translation.
your possible mistake is understandable.
The hockey stick guys make the same mistake on purpose... with plants and trees instead of ice.
This is true about the temperature in general. They claim the records go back to about 1850 but that's absolutely ridiculous. Accurate temp data goes back, maybe 30 years. Before that was a bunch extrapolation and what not which is not accurate at all.
Just look at the political agenda of the idiots who push this nonsense, and its obvious that MMGW is a hoax meant to help get legislation passed.
cmon.
I know you understand you compare apples to apples... proxies to proxies.
it is useful for internal comparison to itself.
But.. you bring up a good point.
Is any of the science regarding CO2 trustworthy enough to be the foundation for agreements which effect economic output of countries or individuals.
I know you understand you compare apples to apples... proxies to proxies.
it is useful for internal comparison to itself.
But.. you bring up a good point.
Is any of the science regarding CO2 trustworthy enough to be the foundation for agreements which effect economic output of countries or individuals.
If the data is questionable, it's still the chart you posted.
Last edited:
You seem to think so, since you continually refer to the CO2 lags temperature chart.
Sphincter, the act is getting old. If the Earth's temp increases, people like you are going to suggest massive regulations that cripple the US economy. If the Earth's temp decreases, people like you are going to suggest massive regulations that cripple the US economy. If the Earth's temp stays the same, people like you are going to suggest massive regulations that cripple the US economy.
You are tuned in with science but believe a person's sex has nothing to do with what genitalia they were born with or what their chromosomes are. You believe it deals only with what a person feels that day.
Following that same line of reasoning, if I feel that my car did not emit any greenhouse gases today even though I drove over 200 miles, does that make it so. If you claim otherwise, you are a bigot.
when the temp drops they will say it is a result of the fine environmental laws they have enacted
when the temp drops they will say it is a result of the fine environmental laws they have enacted
Yes, the Climate Change alarmists will claim success when the temperature drops while ignoring that CO2 is still going up... and the drop in temperatures was due to natural cycles.