You are using an out of date browser. It may not display this or other websites correctly.
You should upgrade or use an alternative browser.
You should upgrade or use an alternative browser.
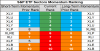
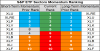
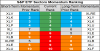
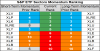
S&P 500 Sector ETF Momentum Rankings
- Thread starter AndersenBands
- Start date
You could just compare them by Stochastic or MACD or RSI levels.
You could just compare them by Stochastic or MACD or RSI levels.
You certainly could. However, since none of those indicators utilize proper mathematics the results would be garbage in = garbage out.
I think my RSI way's as good as your way for long-term, and short-term is generally not worth it anyway.You certainly could. However, since none of those indicators utilize proper mathematics the results would be garbage in = garbage out.
I think my RSI way's as good as your way for long-term, and short-term is generally not worth it anyway.
In your example above, the RSI readings are all clustered together close to a value of 50. If that works for you then by all means carry on. For me the standard "RSI" indicator is inherently flawed for multiple reasons. RSI is dependent on the rate of change (difference in closes) and the range of those closes. Additionally it suffers from change relative to external factors, thus the reading of one instrument's value generally has no direct relationship to another - the RSI value of one instrument (e.g. 70) can only be directly comparable to another instrument with the same value of 70 if the market behavior is exactly the same. In other words the RSI value of a utility stock is not directly comparable to a tech stock, or RSI of Eurodollars futures vs crude oil futures etc.
A symptom of this problem is that the more trendy an active market is, the less sensitive the RSI indicator becomes. With a quiet, sideways market in which the average price swings are relatively small, minor movements in price can force the indicator to move drastically. The more trendy or active a market is, the greater the market movement required to change the indicator value.
Another point of concern with using a finite range measuring oscillator such as RSI is momentum direction. There is a lack of polarity with RSI. A reading of 0 shows the price at the range low in the fixed look-back period. 100 at the high. However, neither of these readings identify positive or negative price momentum. A crossing at "50" does not reflect momentum reversing.
Perhaps one of the greatest challenges with this approach using simple oscillators is the time frame analyzed. An arbitrarily chosen parameter of 14 periods or 100 periods will often have drastic results in terms of relative price change for each finite time period chosen. A 14 period RSI value will generally be quite different than 100 periods. Additionally, using current data RSI values (say prior 6 mos) is not directly comparable to RSI values 5, 10, 15, 20 years ago.
These are brief examples of the inadequate mathematical calculations inherent with using the canned RSI indicator to calculate, categorize and compare momentum across multiple trading instruments and asset classes. Such approach is never applied on the institutional level. At that level, universal, statistical measures that have meaning across all time-frames and all financial instruments are utilized, and thus adopted in the rankings shared here.
However, if what you are doing is robust enough to suit your needs then you are already well on your way.
Good luck and good trades to you!
Last edited:
XLK appears to have been the best one to have over the past year.

In your example above, the RSI readings are all clustered together close to a value of 50.
If you are referring to the chart he posted, it appears to list Relative Strength, which is different from the RSI oscillator. Your comments are accurate regarding RSI but perhaps not so when applied to relative strength.
It is not clear to me what the difference is in comparing relative strength and relative momentum, since either will involve comparing relative percent moves over a defined time period.
There have been studies that showed some added alpha from following a relative strength strategy to switch among sector ETFs, but as I recall , the edge was not as large as one might have expected. Certainly there can be relatively long periods of substantial outperformance. For example, long ELK killed it last year. Prior to that we had a sustained period where bond substitutes like XLU and XLP outperformed.
From a macro perspective, there generally are underlying economic conditions that drive this relative performance. Last year we had strong growth and quiet inflation, which historically benefits high growth tech. Prior to that, we had slow growth and a zero rate policy, which drove investors to bond substitutes.
The tricky aspect to this is you are basing forward projections, ie what to buy or sell, on rearview mirror readings. It's easy to buy at the top or sell at the bottom. Still I think there is a lot of merit to viewing the market in this fashion. My experience has been that the keys to making money are one, cutting losses quickly, and two, being in the right sectors.