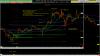
Recognizing Reversals from the Top/Highs

In trading, you gotta recognize a lot of things: 1) uptrend 2) downtrend 3) reversals from bottom 4) reversals from top/highs 5) choppy 6) consolidation etc.

Congratulations on redeveloping Dow Theory from the ground up.

 
Tom DeMark is above my pay grade

There's zero evidence that Demark can outperform an index fund. Yes, he wrote a book with fancy-schmancy indicators, one of them supposedly can help you call tops. Unless he provides account statements or even backtests of his indicators after he introduced them in his books, there's absolutely no reason to worship or even follow the guy.
https://www.quantopian.com/posts/demark-indicators-backtested

To answer TS' question, if any of us figured out a highly reliable way to locate and trade market tops/bottoms, we'd be on a yacht counting stacks of $1,000 bills...not posting on ET.
 
Last edited:
So, how do you guys approach this? I don't think it's as simple as the complement/opposite of the signal that tells me the reversal from the bottom. I think the reversal from the top is harder to see/recognize in real time until it's too late.
For me it is as simple as the opposite of the signal that tells me the reversal from the bottom. But as you kind of implied in the paragraph preceding the one cited above, it all depends on the nuances incorporated in your system.
 
on a yacht counting stacks of $1,000 bills

MKTrader, you sound like you been around the block

highly reliable, yeah that's asking a lot. anything somewhat reliable that you know of off the top?

what's your take on fib price projections as one tool in the box for the op to "help recognize possible reversals from long trends"?
cheers

on a yacht counting stacks of $1,000 bills
btw, I always picture that scene in 'snatch' dennis farina, talking about boat drinks. the dialect in that flick is freakin' great.
 
MKTrader, you sound like you been around the block

highly reliable, yeah that's asking a lot. anything somewhat reliable that you know of off the top?

what's your take on fib price projections as one tool in the box for the op to "help recognize possible reversals from long trends"?
cheers

on a yacht counting stacks of $1,000 bills
btw, I always picture that scene in 'snatch' dennis farina, talking about boat drinks. the dialect in that flick is freakin' great.

Unfortunately, I've never seen any hard, systematic evidence of the markets following Fibonacci patterns. It's possible that prices may occasionally pause at a highly watched Fib level, the same way stock indexes pause at major round number prices (like S&P 500 at 3000). But that doesn't help you determine the future price. It's just a self-fulfilling prophecy.
 
I analyzed reversals by studying bar context at the up/bottom. when you see lower higher and lower lower, sometimes it is quite late.
%%
Late is good, especially with profits. Most bottoms are a multi-month W-- not a v. Looks like the 2019 bottom was a ''v'' not a w, so its not about predicting:cool::cool:, :cool::cool::cool::cool::cool::cool::cool:Thanks for the post,i use candles mostly ; IBD uses red ,white + blue bars.
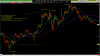
 
Recognizing Reversals from the Top/Highs

Inverted Hammer, Hanging Man, Shooting Star

Hammertime 776.png

Hammertime 776.png
https://www.investarindia.com/blog/candlestick-chart-patterns-hammer-inverted-hammer-hanging-man/
https://elitetrader.com/et/threads/...o-man-and-beast-right-here-baby.335635/page-5
https://elitetrader.com/et/threads/cardiovascular.335482/
 

Attachments

  • Charts Gone Wild, Hammertime 776.png
    Charts Gone Wild, Hammertime 776.png
    109.9 KB · Views: 16
Last edited:

https://www.forbes.com/sites/johnna...n-interview-with-michael-harris/#769bf91c4733

"In essence, the pioneers of this method were fooled by high autocorrelation and assigned forecasting power to random patterns. As high autocorrelation started disappearing from the markets in the 1980s, these technical analysis methods lost any effectiveness. However, a large industry has already invested in these methods and they are still being taught and used. Videos are uploaded daily in social media to teach traders how to use chart patterns when in reality, in algo-dominated markets, classical patterns are random formations caused by these algos."
 
Back
Top