You are using an out of date browser. It may not display this or other websites correctly.
You should upgrade or use an alternative browser.
You should upgrade or use an alternative browser.
Pricing Skew/Identifying Mispriced Non-ATM options
- Thread starter JetFlankRight
- Start date
OHLC
You can get OHLC IV market data as frequently as every minute, but you may have to wait till after the close to get it. They'll charge you significantly more (30%+) if you say you're with a prop group, hedge fund, bank desk, etc. So tell them your an academic, student, or part-time retail investor and you'll get a 30% discount from what they charge the big boys.
https://www.ivolatility.com/data/us-historical-intraday-options-data2.html?smid=.3.1.1.2
https://datashop.cboe.com/option-quotes-intervals-with-calcs-subscription
Who has a ready to go service ??
Im interested
You can get OHLC IV market data as frequently as every minute, but you may have to wait till after the close to get it. They'll charge you significantly more (30%+) if you say you're with a prop group, hedge fund, bank desk, etc. So tell them your an academic, student, or part-time retail investor and you'll get a 30% discount from what they charge the big boys.
https://www.ivolatility.com/data/us-historical-intraday-options-data2.html?smid=.3.1.1.2
https://datashop.cboe.com/option-quotes-intervals-with-calcs-subscription
How do you go about pricing skew in a way to identify mispricings in skewed options? If ATM vol of a stock is 50, and say historical vol has been 55 (not that this would ever happen) you can have some basis for saying that vol is cheap.
But how does this extend to skew? If ATM vol is 50, but the 30 delta put is trading 55, is it too expensive? Too cheap? I know that puts tend to trade above ATM, but how do you get a sense of what's cheap or expensive?
Phrased another way, if I tell you a $50 stock has ATM vol is 50 and I ask you to price the $30 put and $80 call, how would you go about doing that? What other information would I want in this case?
I know that you could in theory back out an implied distribution of sorts, but I'm not sure how common that is and whether that's typical? Just trying to develop some intuition for identifying when skew is expensive or cheap.
What you are thinking about is the volatility surface, and if there are anomalies that you can take advantage of profitably. In theory, if a properly normalized surface is stable over time, then yes you could look for mispricings that way. That is the theory anyway. However, lots of big players with deeper pockets and much more computing power than you are doing the same thing, so good luck!
Matt_ORATS
Sponsor
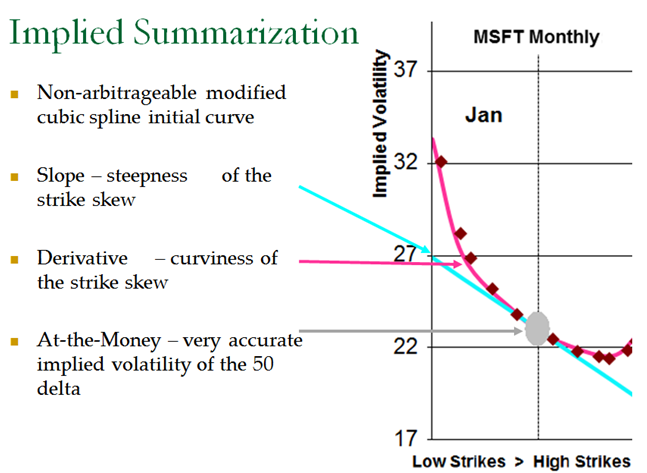
My firm, ORATS describes the implied volatility surface as a 3-dimensional surface where the independent variables are time to expiration, and option delta and the dependent variable is implied volatility. To illustrate an implied volatility surface, we have developed a 2-dimensional graph that displays all three axes in the figure below. Summary information about this surface gives the trader a macro view of the implied volatilities for each option chain. ORATS takes a snapshot of all options on all symbols approximately 14 minutes before the close of trading. Options markets from this time are often of higher quality than at the close.
ORATS measures the surface using the following summary characteristics: at-the-money volatility, strike slope, and derivative (curvature).
Delta is best to use on the x-axis as was said earlier it normalizes the skew so you can compare different expirations and different stocks.
In our service all this can be graphed historically on our web tool or downloaded in our API.
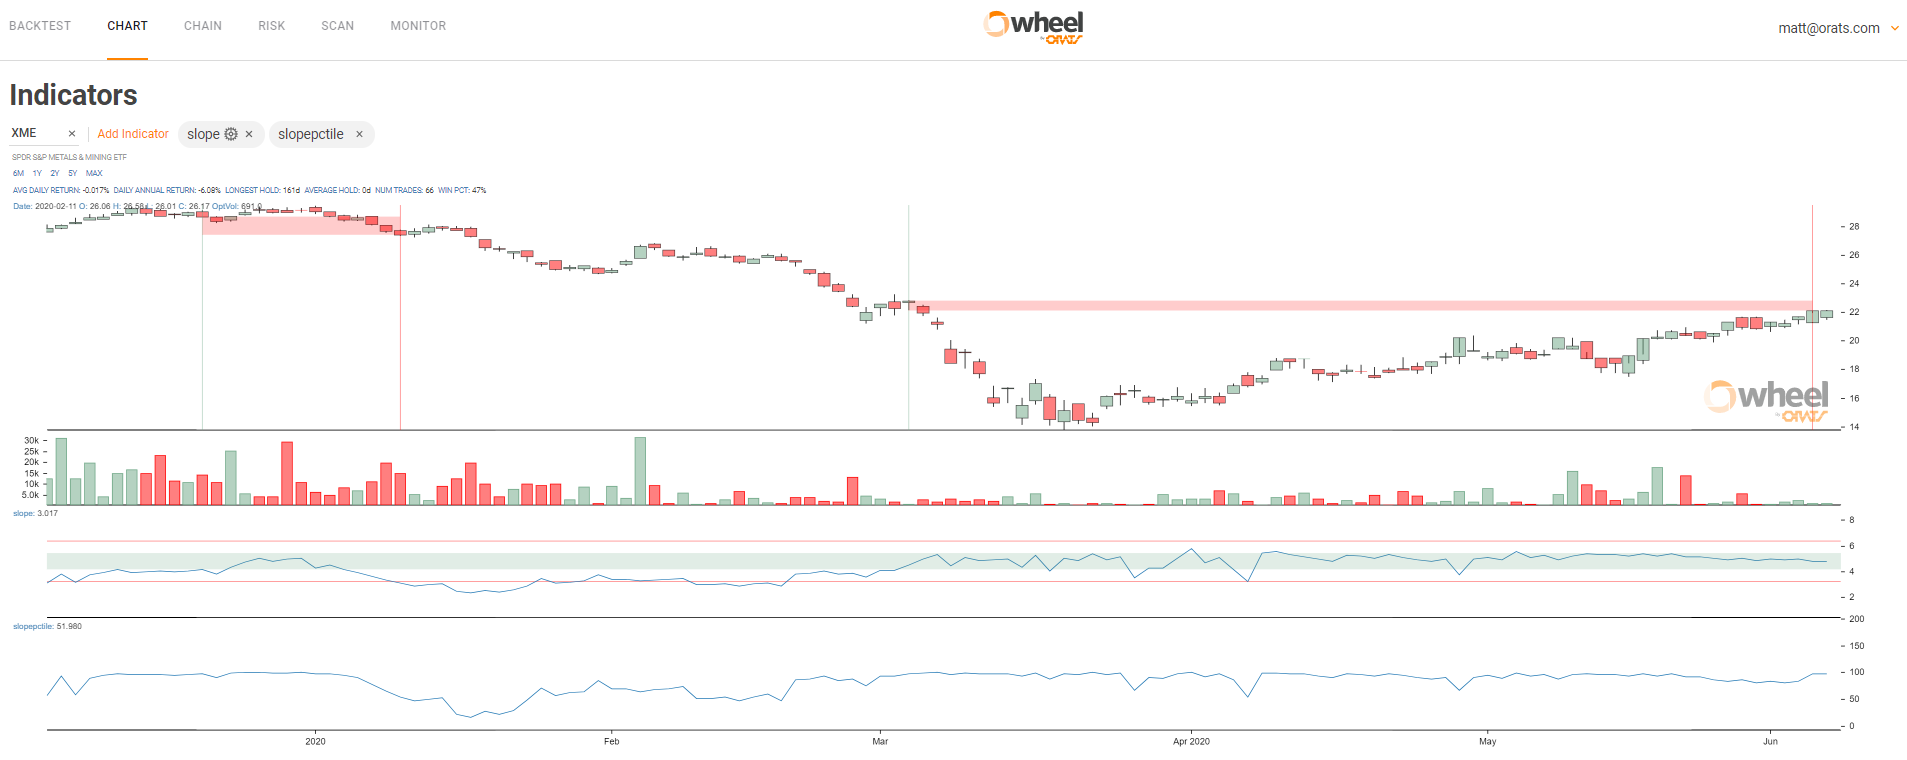
For example, IYR's slope looks cheap and XME's slope looks expensive from a variety of measurements:

1. We have a forecast of slope and that forecast is above IYRs current slope.
2. IYR has a relatively low slope percentile vs say XME whose slope percentile is higher, see below.
3. ORATS also has a measurement of the component averages for all readings including slope, and slope percentile. The ratio of IYR's components slope to IYR's slope makes the ETF look cheap and opposite for XME.
4. We also compare the ETFs to the SPY and track the relationship. For stocks, we track the relationship of the best ETF.
If you look in our documentation you can see the names and descriptions. We also have blogs about slope.
https://docs.orats.io/data-api-guide/definitions.html#core-general
https://blog.orats.com/hs-search-results?term=slope&type=BLOG_POST&id=6125614442
slopepctile one-year percentile for the slope
slopeavg1m slope average for trailing month
slopeavg1y slope average for trailing year
slopeStdv1y standard deviation of the Slope
etfSlopeRatio slope divided by ETF slope current
etfSlopeRatioAvg1m slope divided by ETF slope month average
etfSlopeRatioAvg1y slope divided by ETF slope year average
etfSlopeRatioAvgStdv1y slope divided by ETF slope year standard deviation
ORATS measures the surface using the following summary characteristics: at-the-money volatility, strike slope, and derivative (curvature).
Delta is best to use on the x-axis as was said earlier it normalizes the skew so you can compare different expirations and different stocks.
In our service all this can be graphed historically on our web tool or downloaded in our API.
For example, IYR's slope looks cheap and XME's slope looks expensive from a variety of measurements:
1. We have a forecast of slope and that forecast is above IYRs current slope.
2. IYR has a relatively low slope percentile vs say XME whose slope percentile is higher, see below.
3. ORATS also has a measurement of the component averages for all readings including slope, and slope percentile. The ratio of IYR's components slope to IYR's slope makes the ETF look cheap and opposite for XME.
4. We also compare the ETFs to the SPY and track the relationship. For stocks, we track the relationship of the best ETF.
If you look in our documentation you can see the names and descriptions. We also have blogs about slope.
https://docs.orats.io/data-api-guide/definitions.html#core-general
https://blog.orats.com/hs-search-results?term=slope&type=BLOG_POST&id=6125614442
slopepctile one-year percentile for the slope
slopeavg1m slope average for trailing month
slopeavg1y slope average for trailing year
slopeStdv1y standard deviation of the Slope
etfSlopeRatio slope divided by ETF slope current
etfSlopeRatioAvg1m slope divided by ETF slope month average
etfSlopeRatioAvg1y slope divided by ETF slope year average
etfSlopeRatioAvgStdv1y slope divided by ETF slope year standard deviation
My firm, ORATS describes the implied volatility surface as a 3-dimensional surface where the independent variables are time to expiration, and option delta and the dependent variable is implied volatility. To illustrate an implied volatility surface, we have developed a 2-dimensional graph that displays all three axes in the figure below. Summary information about this surface gives the trader a macro view of the implied volatilities for each option chain. ORATS takes a snapshot of all options on all symbols approximately 14 minutes before the close of trading. Options markets from this time are often of higher quality than at the close.
ORATS measures the surface using the following summary characteristics: at-the-money volatility, strike slope, and derivative (curvature).
Delta is best to use on the x-axis as was said earlier it normalizes the skew so you can compare different expirations and different stocks.
In our service all this can be graphed historically on our web tool or downloaded in our API.
For example, IYR's slope looks cheap and XME's slope looks expensive from a variety of measurements:
1. We have a forecast of slope and that forecast is above IYRs current slope.
2. IYR has a relatively low slope percentile vs say XME whose slope percentile is higher, see below.
3. ORATS also has a measurement of the component averages for all readings including slope, and slope percentile. The ratio of IYR's components slope to IYR's slope makes the ETF look cheap and opposite for XME.
4. We also compare the ETFs to the SPY and track the relationship. For stocks, we track the relationship of the best ETF.
If you look in our documentation you can see the names and descriptions. We also have blogs about slope.
https://docs.orats.io/data-api-guide/definitions.html#core-general
https://blog.orats.com/hs-search-results?term=slope&type=BLOG_POST&id=6125614442
slopepctile one-year percentile for the slope
slopeavg1m slope average for trailing month
slopeavg1y slope average for trailing year
slopeStdv1y standard deviation of the Slope
etfSlopeRatio slope divided by ETF slope current
etfSlopeRatioAvg1m slope divided by ETF slope month average
etfSlopeRatioAvg1y slope divided by ETF slope year average
etfSlopeRatioAvgStdv1y slope divided by ETF slope year standard deviation
Do you have a link to the formula used for calculating the "Derivative - curviness of the strike skew"?
My firm, ORATS describes the implied volatility surface as a 3-dimensional surface where the independent variables are time to expiration, and option delta and the dependent variable is implied volatility. To illustrate an implied volatility surface, we have developed a 2-dimensional graph that displays all three axes in the figure below. Summary information about this surface gives the trader a macro view of the implied volatilities for each option chain. ORATS takes a snapshot of all options on all symbols approximately 14 minutes before the close of trading. Options markets from this time are often of higher quality than at the close.
ORATS measures the surface using the following summary characteristics: at-the-money volatility, strike slope, and derivative (curvature).
Delta is best to use on the x-axis as was said earlier it normalizes the skew so you can compare different expirations and different stocks.
In our service all this can be graphed historically on our web tool or downloaded in our API.
For example, IYR's slope looks cheap and XME's slope looks expensive from a variety of measurements:
1. We have a forecast of slope and that forecast is above IYRs current slope.
2. IYR has a relatively low slope percentile vs say XME whose slope percentile is higher, see below.
3. ORATS also has a measurement of the component averages for all readings including slope, and slope percentile. The ratio of IYR's components slope to IYR's slope makes the ETF look cheap and opposite for XME.
4. We also compare the ETFs to the SPY and track the relationship. For stocks, we track the relationship of the best ETF.
If you look in our documentation you can see the names and descriptions. We also have blogs about slope.
https://docs.orats.io/data-api-guide/definitions.html#core-general
https://blog.orats.com/hs-search-results?term=slope&type=BLOG_POST&id=6125614442
slopepctile one-year percentile for the slope
slopeavg1m slope average for trailing month
slopeavg1y slope average for trailing year
slopeStdv1y standard deviation of the Slope
etfSlopeRatio slope divided by ETF slope current
etfSlopeRatioAvg1m slope divided by ETF slope month average
etfSlopeRatioAvg1y slope divided by ETF slope year average
etfSlopeRatioAvgStdv1y slope divided by ETF slope year standard deviation
This is a skew arb thread and it reads like a 12-step program. Just roll-over until the urge passes... or simply subscribe to ORATS.
Matt_ORATS
Sponsor
Thanks DestThis is a skew arb thread and it reads like a 12-step program. Just roll-over until the urge passes... or simply subscribe to ORATS.
Getting skew right has taken a large part of my trading life while on the floor and backing traders, and my professional life with ORATS, and a good deal of wealth. Sometimes I wish I had advice like yours 25 years ago.
Matt_ORATS
Sponsor
Hi VolSkewTraderDo you have a link to the formula used for calculating the "Derivative - curviness of the strike skew"?
Our method is less of a formula and more of a process.
Strike Slope is a measure of the amount that implied volatility changes for every increase of 10 call delta points within the intra-month skew. It measures how lopsided the 'smile' or 'smirk' is. The derivative is a measure of the rate at which the strike slope changes for every increase of 10 call delta points within the intra-month skew. It measures the curvature of the intra-month skew or 'smile.' We chose just two parameters to describe the skew to get a reasonable fit for the fewest assumptions.
We start with lining up the calls and puts IVs using residual yields. We use the 85 to 15 call deltas in the study. We have more weightings to the call an puts for closeness to the 50 delta and we weight the call vs put the more OTM we go, meaning the 20 delta call IV will get more weighting than the same strike 80 delta put: The IVs will be slightly different even after our residual yield process. Then on to estimating the slope with a best fit, and we are left with errors from the slope line to the actual mid market IVs. We apply the derivative to minimize those errors.
Do you use BSM or binomial or something else to compute your output?Hi VolSkewTrader
Our method is less of a formula and more of a process.
Strike Slope is a measure of the amount that implied volatility changes for every increase of 10 call delta points within the intra-month skew. It measures how lopsided the 'smile' or 'smirk' is. The derivative is a measure of the rate at which the strike slope changes for every increase of 10 call delta points within the intra-month skew. It measures the curvature of the intra-month skew or 'smile.' We chose just two parameters to describe the skew to get a reasonable fit for the fewest assumptions.
We start with lining up the calls and puts IVs using residual yields. We use the 85 to 15 call deltas in the study. We have more weightings to the call an puts for closeness to the 50 delta and we weight the call vs put the more OTM we go, meaning the 20 delta call IV will get more weighting than the same strike 80 delta put: The IVs will be slightly different even after our residual yield process. Then on to estimating the slope with a best fit, and we are left with errors from the slope line to the actual mid market IVs. We apply the derivative to minimize those errors.
Matt_ORATS
Sponsor
We use a binomial tree approach as described in Haug "The Complete Guide to Option Pricing Formulas".Do you use BSM or binomial or something else to compute your output?