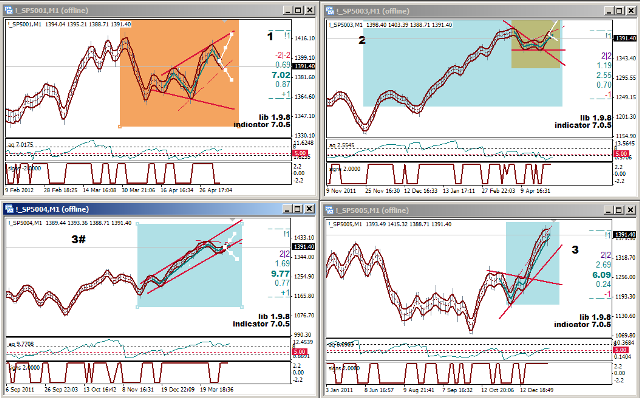
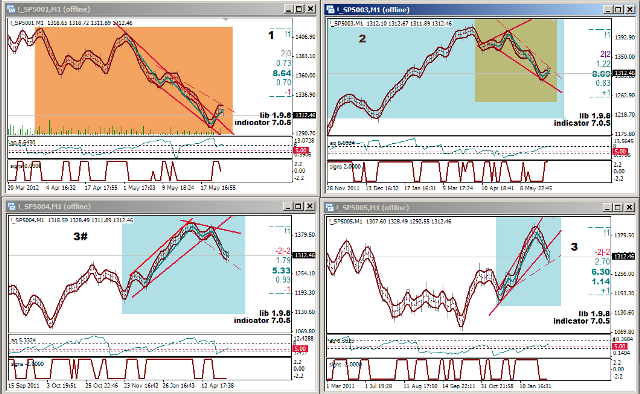
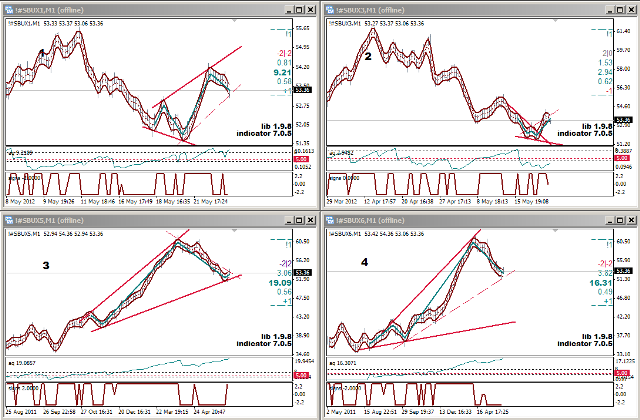
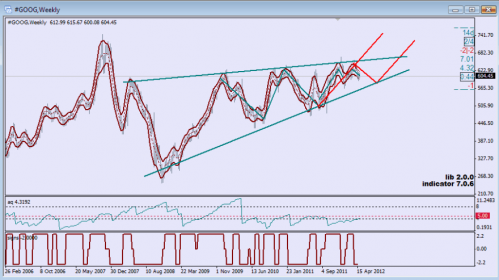
GOOG is preparing to jump
red lines represent two possible scenarios
(do not have enough data in Alpari MT4 to provide usual time-compressed charts, so can show only as is)
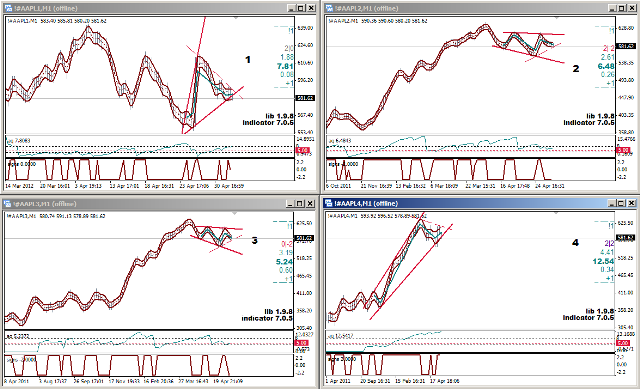
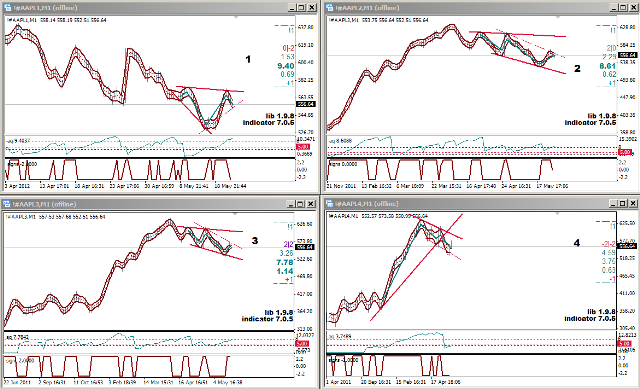
AMZN - oscillations with very high quality
and now we see that the last GAP was an simple continuation of the previous configuration, i.e. market has supposed it long before "the event"
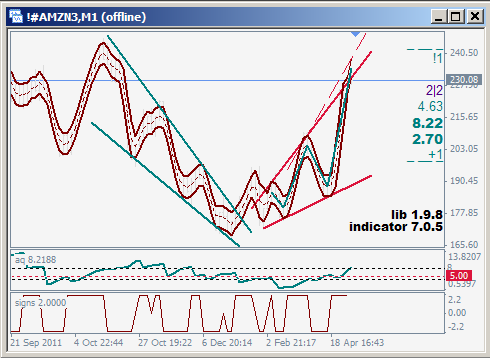
probably the oscillations will continue for some time, so pullback is expected
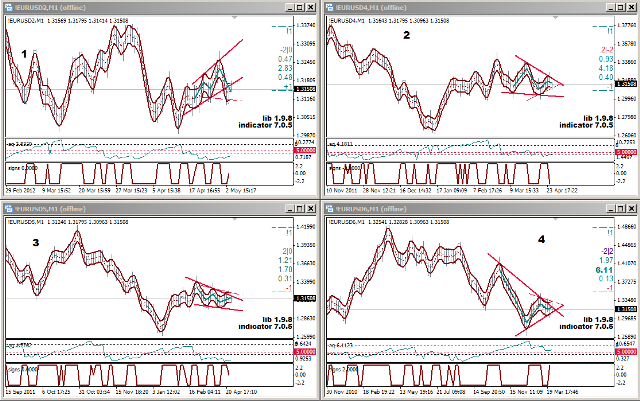
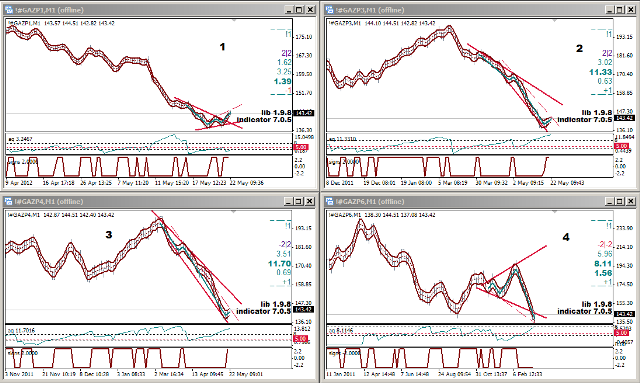
red lines represent two possible scenarios
(do not have enough data in Alpari MT4 to provide usual time-compressed charts, so can show only as is)
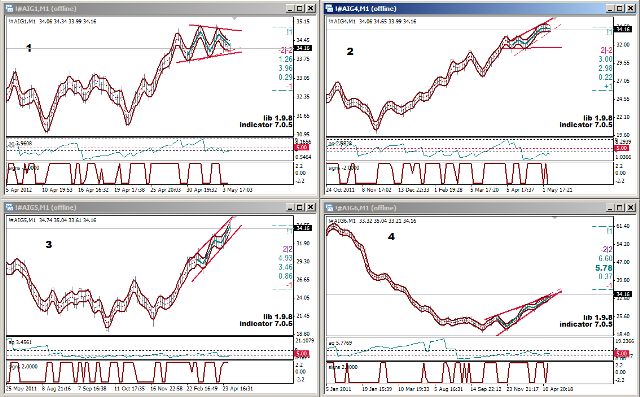
AMZN - oscillations with very high quality
and now we see that the last GAP was an simple continuation of the previous configuration, i.e. market has supposed it long before "the event"
probably the oscillations will continue for some time, so pullback is expected