Price bars are, I suppose, in a sense, artificial, whether represented by time, volume, reversals, ticks, what-have-you. This doesn't mean the individual bars can't or don't have meaning when taken in context. Consider a simple strategy using a triple timeframe analysis. First is the longest timeframe for potential support/resistance and trend areas (daily chart here), then go to the intermediate timeframe (4HR) for a setup, then the smallest timeframe (1HR) for entry, and finally back to the the intermediate timeframe again for trade management - stops, scaling, and exit. EURJPY:
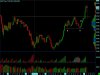
DAILY - Following the uptrend in April, in May there is a consolidation. Note the heavy wave volume at A (ellipse) which fails to break that previous low to the left at X - Effort vs Reward. This bullish behavior is confirmed at B on the wide-spread up bar closing at the high 5/27.
Note the cluster of opens/closes on the four bars just before just before A. Such clusters often signal an inability to continue in the current direction, here the downward reaction. The spreads - to an extent - and candle bodies - most certainly - contract on the reaction relative to most recent price behavior. At A price stops a few ticks above the previous low at X on very narrow candle bodies, then a wide spread up on good volume closing on the high back to the opens/closes of that previous shelf before A.
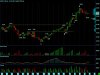
4-HR - Following the rally from C, at D there is low wave volume reaction that finds support at previous resistance from 5/21-5/22. Confirmed at E on the widest spread up in several days.
From C to the high before D note the prevalence of green candles and their spreads vs the reds. The relative up wave volume is so strong on this rally one might suspect a climax, however the pullback to D is very shallow, brief, at previous s/r, on narrow spreads and low wave volume.
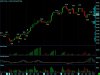
1-HR - At F on 6/1 a reaction where price makes no downward progress at all, a small cluster, then another cluster at G with no downward progress on very low wave volume. (Entry points.)
At F there is a relatively wide spread up, then an equal spread down which wipes it out, but there is no follow-thru down, next bar equal spread right back up. Note strong individual volume on that down bar that fails to produce results - Effort vs Reward. Then a relatively wide spread closing on the high breaking out of that cluster, confirmation bar.
The reaction at G another cluster, shallow retracement, narrow spreads, low volume.
4-HR - Nice rally to I, then the first 2-bar pullback to J on low volume and little price progress down. There's a nice smooth rally to K, here is strong resistance at a previous high on the daily chart, so resistance is certainly expected in this area on the lower timeframes. Note here the second down bar is the widest spread down bar since 5/22.
The rally to I is on mostly wide spreads closing on the highs on strong volume, the reaction to J a cluster, shallow, narrow spreads, low volume. Wait, didn't I just say that?
Rally to K quick on very wide spreads closing on the highs, to that previous daily resistance, on lower wave volume followed by the longest, deepest reaction (currently at 50% of the previous wave from J, always a significant point) since the rally began at C. Note the narrow candle bodies and cluster of closes since that second down bar with the strong down wave volume. Effort vs Reward? Though, natch, we may get further consolidation or retracement in the shorter term, at this point I'm looking for this rally to continue in the intermediate (from C) stage.
DAILY - Following the uptrend in April, in May there is a consolidation. Note the heavy wave volume at A (ellipse) which fails to break that previous low to the left at X - Effort vs Reward. This bullish behavior is confirmed at B on the wide-spread up bar closing at the high 5/27.
Note the cluster of opens/closes on the four bars just before just before A. Such clusters often signal an inability to continue in the current direction, here the downward reaction. The spreads - to an extent - and candle bodies - most certainly - contract on the reaction relative to most recent price behavior. At A price stops a few ticks above the previous low at X on very narrow candle bodies, then a wide spread up on good volume closing on the high back to the opens/closes of that previous shelf before A.
4-HR - Following the rally from C, at D there is low wave volume reaction that finds support at previous resistance from 5/21-5/22. Confirmed at E on the widest spread up in several days.
From C to the high before D note the prevalence of green candles and their spreads vs the reds. The relative up wave volume is so strong on this rally one might suspect a climax, however the pullback to D is very shallow, brief, at previous s/r, on narrow spreads and low wave volume.
1-HR - At F on 6/1 a reaction where price makes no downward progress at all, a small cluster, then another cluster at G with no downward progress on very low wave volume. (Entry points.)
At F there is a relatively wide spread up, then an equal spread down which wipes it out, but there is no follow-thru down, next bar equal spread right back up. Note strong individual volume on that down bar that fails to produce results - Effort vs Reward. Then a relatively wide spread closing on the high breaking out of that cluster, confirmation bar.
The reaction at G another cluster, shallow retracement, narrow spreads, low volume.
4-HR - Nice rally to I, then the first 2-bar pullback to J on low volume and little price progress down. There's a nice smooth rally to K, here is strong resistance at a previous high on the daily chart, so resistance is certainly expected in this area on the lower timeframes. Note here the second down bar is the widest spread down bar since 5/22.
The rally to I is on mostly wide spreads closing on the highs on strong volume, the reaction to J a cluster, shallow, narrow spreads, low volume. Wait, didn't I just say that?
Rally to K quick on very wide spreads closing on the highs, to that previous daily resistance, on lower wave volume followed by the longest, deepest reaction (currently at 50% of the previous wave from J, always a significant point) since the rally began at C. Note the narrow candle bodies and cluster of closes since that second down bar with the strong down wave volume. Effort vs Reward? Though, natch, we may get further consolidation or retracement in the shorter term, at this point I'm looking for this rally to continue in the intermediate (from C) stage.