Quote from krtrader09:
The way that I trade using price action is as follows:
1) I use a few specific price action setups that I have found to be profitable for me.
2) I trade with the dominant trend.
3) I mark the important support and resistance levels and watch these are areas for price action setups.
4) I sometimes use a few moving averages just to draw my eye to support and resistance, I never use volume or any lagging price indicator, I think they are extremely counter-productive.
Here is a chart of some of the things I look for.
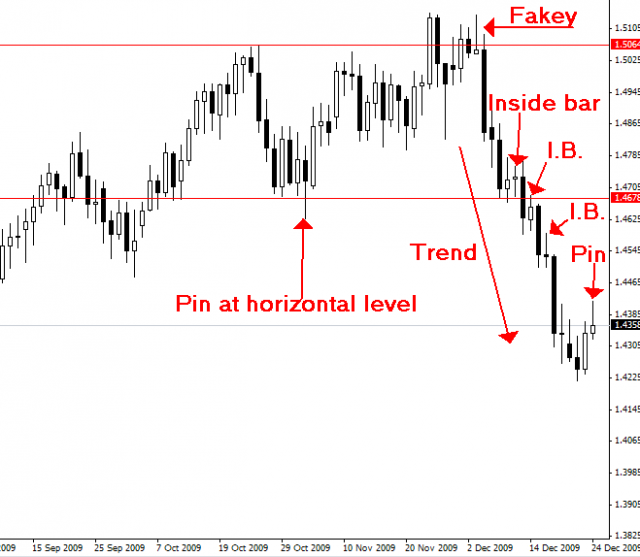
Could you please explain what you mean with the inside bars etc... The chart shows exactly one of my setups.
Where is your trade entry and where do you have the stop?