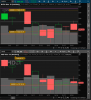
Market still in technical downtrend. Honestly, you could probably open a random short and come back in a couple of weeks to see a profit. NVDA-AMD displaying similar level patterns. One of the market truisms is that in uptrends, support holds, and in downtrends, resistance holds. NVDA and AMD have not been able to break their resistances. Additionally, their supports have been tested/used several times already, implying that the supports are weaker now. Months ago, I was talking about the large open air on AMD in the 74-60 range, and that is still valid. A break can get there for a violent drop, even if it doesn't test 60. Although a short signal has not been generated on the lower downside red levels yet, they have been using up event types and have stayed there for longer than ever before, which is also bearish. Should have just held NVDA short as a swing, market gave multiple opportunities to do so and I knew this stuff was going to go down... my dumb fear. I need to have courage to hold for the next downside breakout once a signal is generated. Lots of good short trades keep coming in this market and the downmoves are the ones that make it big, not the others... keep playing myself on the garbage trades.

You are using an out of date browser. It may not display this or other websites correctly.
You should upgrade or use an alternative browser.
You should upgrade or use an alternative browser.
Prediction Based Trading
- Thread starter stockpredictor
- Start date
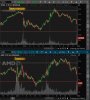
Shorted a bunch of AMD at 74.20. We should get some big red days ahead.
O come on. AMD announced share buyback and it had a crazy candle up to 76 as of right now. This isn't fair
412.84 is where the SPY level should drop here... I'm already short so I'm not adding to it though.
Lost around 10% in total after closing out all positions on Friday including T long which I shouldn't have taken. @userque mentioned to beware of black swan events, and that was AMD's announcement of stock buybacks where it shot up. I messed it up and held longer than I should have, and it became a bigger loss. I then shorted AAPL's high of the day for some gain and held it too long (due to greed) even though I specifically knew it had a decent chance of going up the next day simply because the gap-down event type had already been used and not the High-of-Day event. And that winner turned into a loss. From there, I shorted a few other stocks on their highs later and they all worked out and I closed them for profits. I closed the AAPL and AMD shorts on Friday's red day. Need to reassess. Want to start fresh on Monday. Not sure where the market goes now. Some ambiguous things here and there. One thing Jesse Livermore says is that when a stock doesn't act as it should, you get out.We'll see how things go.

This is what I was looking at when I made the trade. Epic failure.
This is what I was looking at when I made the trade. Epic failure.
Attachments
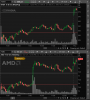
One bad trade doesn't define you.This what I was looking at when I made the trade. Epic failure.
I was using my old email and saw a recent notification and so I decided to check this out too. Otherwise I never. I got a real job so I don't have to wake up so early anymore or study the markets. I do normal things like read and I like to write. I haven't traded in a long time, I don't really care about that stuff anymore
Levels are predetermined for years to come, and trades are based on those levels. New levels generated if a market makes new highs. Instead of making new threads for various trades, I will be posting predictions/forecasts, trades, thoughts, etc here as well as on my twtr.
Next week's intraday trades are, but not limited to, as follows:
If a day's open on
BABA is under 297.99, short when hit
SNAP is over 25.93, long when hit
SNAP is over 24.86, long when hit
FB is over 241.27, long when hit
NVDA is over 537.57, long when hit
NVDA is over 553.20, long when hit
BA is over 185.19, long when hit
UAL is over 40.19, long when hit
UAL is under 30.72, short when hit
AAPL is under 124.85, short when hit
TSLA is over 458.90, long when hit
AMD is under 73.86, short when hit
JNJ is over 150.67, long when hit
What is more important, however, is the bigger picture. Looking at the indices, we have broken through prior resistances on multiple vehicles. What makes this significant is that these were longer term levels derived independently, implying a clear continuation signal. Think of it as the shoreline; the waves are sometimes higher, sometimes lower. Is the tide actually rising? We look from different vantage points, and if they all are rising, then it tells us that yes, it is. Similarly, the indices done so. See images as follows. You can see in my other post that the Dow Jones on 10/6 was a buy signal, but only intraday; it reacted right on the 281.47 level and went as high as the Russell resistance which was when everything all tanked. That's why it only looks like a false breakout on the Daily level but the key is that the longer timeframes must align, which happened on the Russell but not this one, at that time. It works either way, it is just that the larger moves need that confluence while the others are mere reactions. SPY and SPX show similar things.
However, there is almost always a thesis for the other side. QQQ Daily and Russell Weekly show up as resistance. These are not strong resistances, however. For one, QQQ already tested that point, implying that the more a door is knocked, the greater the likelihood of it opening. In addition, it has a lower winrate in isolation. For the Russell Daily, it has too many levels to use reliably so I won't even be considering it in this range. However, the Weekly appears to have overshot. The reason it is weak is because it generated a reaction on the shorter term Daily level, right on the Trump tweet, which matched the Daily level too. Actually, this is common, expecting a level break- by trading it as a reaction only, it avoids the reversal possibility. Because the market had the chance to generate a continuation down but did not, implies that the market wants to go up. Livermore in the 20s and De la Vega in the 1680s both noted that bull markets shrug off bad news and bear markets shrug off good news. This is an example of that, and is also an example of how one can profit even when wrong.
So, what to do? Because the levels are similar in distance, I am looking for ideally 2+ hits on support. It could have been bought this week but I wanted a weekly confirmation bar, which required this week to end. That is, I want to buy when price falls into a level while still being in an uptrend. Price may simply run away and I won't get in. However, price typically does get back. Price may also hit one level and then gap under another in a different day. If so, I would like to buy if it hits another lower price, which would appear as even more hits on the Weekly. It all depends. However, the trend up is pretty clear, and there is no indication yet of a correction. We are buy the dip mode.