You are using an out of date browser. It may not display this or other websites correctly.
You should upgrade or use an alternative browser.
You should upgrade or use an alternative browser.
Predicting Intraday Movement 1 Week in Advance
- Thread starter stockpredictor
- Start date

View attachment 240708
The initial reaction when it comes to predictions.
Professionals, don't use that word. They avoid it like a plague.
+100 we don't predict, we react
No we don't. You might. I forecast+100 we don't predict, we react
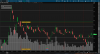
Thanks, much appreciated. I'm certain there are better ways to manage the r:r though. There are certain recurrent properties of these levels that I haven't tested. For example, this BA trade was longed on the first candle of the day, and went straight down. It went back to breakeven, but only barely. I call this the anchor theory- price will return to the signal level as a price flip (support becomes resistance, etc) This was actually the case on Friday as well with this SPY trade. Does this phenomenon occur mainly during early morning? Should level reversions be used instead of taking it as a normal trade instead? If so, the next closest index can be used to time the movement. There are various other phenomena that can be objectively quantified. All my levels are noted in advance, as they keep moving along them even years later- I've shown it in this 15 min SPY chart. Although this thread was mainly for intraday predictions, I can do longer term ones to predict trends using a related methodology- I did not do so because those opportunities for swings do not occur as often. However, one can see that the levels capture the bulk of the move with relatively low drawdowns using swing strategies.
Selection is key, as is trading ranges. Look at a couple of my recent picks eg JKS RKT DKNG PENN and compare r:r vs your ba chart, on 90day daily candle chart.
I like your idea re anchor, similar to mean regression line. Lots of mean reversion patterns in current markets.
JKS = rockstar breakout
LAC = great daytrading chart fri
BA = i would never trade this
Last edited:
If you believe its a mean reverting process I would suggest fitting a stochastic model to it, such as Orstein-Uhlenbeck or Cox-Ingersoll-Ross (square root diffusion). Forecasting involves probability and analysis and is rigorous, at least the way I do it
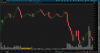
You are not wrong. Those were excellent picks, well done. My system uses these predetermined historical levels which can be used in a swing and intraday fashion, as there is correlation among them. Looking at the BA move on the longer timeframe, it appeared as the lower range touch which was actually the day of the low, which qualified as a swing setup in addition to an intraday setup. One would have thought the trade would be a technical failure if looking only at the daily level, but the intraday movements for a bounce or using the anchor for breakeven makes losses occur quite infrequently. The problem is obviously letting a losing trade run to avoid loss, which isn't an option. However, the setups as such allow for hybrid systems where all swing setups contain intraday setups, but not the other way around. There are only a handful of events that the market keeps repeating. Of course, there are good r:r trades even intraday- see the Russell image, captured the exact day of the high on Wednesday.
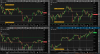
It is sometimes mean reverting, but the problem is that we don't know until already having entered based on the signal. We could wait and assume that price fails (due to momentum, consolidation too near a level, whatever), then enter on the failure. However, this would reduce the total number of signals significantly. This failure's extreme could be measured by a correlated signal system, which is my bread-and-butter- see chart with 4 indices. Deriving these historical levels uses what I suspect are similar to fractographical distributions (not to be confused with fractals), the study of fractures. If you break glass, it has a certain pattern vs breaking a rock, for example. These 'breaks' along levels and ranges can be predicted. Simultaneous hits are not the only things being used- I use the same method to derive levels on even longer timeframes which contribute to the prediction/forecast/reaction of expected moves. For example, a double bottom on the shorter timeframe may hold because it was a fresh single hit on a longer timeframe, which happened to line up with another index. The same method used on disparate vehicles helps avoid the problem of similarly derived indicators all showing the same thing compared to coincidental based level hits. Think steps vs ramps, gaussian vs Possian distribution, etc.
It is sometimes mean reverting, but the problem is that we don't know until already having entered based on the signal. We could wait and assume that price fails (due to momentum, consolidation too near a level, whatever), then enter on the failure. However, this would reduce the total number of signals significantly. This failure's extreme could be measured by a correlated signal system, which is my bread-and-butter- see chart with 4 indices. Deriving these historical levels uses what I suspect are similar to fractographical distributions (not to be confused with fractals), the study of fractures. If you break glass, it has a certain pattern vs breaking a rock, for example. These 'breaks' along levels and ranges can be predicted. Simultaneous hits are not the only things being used- I use the same method to derive levels on even longer timeframes which contribute to the prediction/forecast/reaction of expected moves. For example, a double bottom on the shorter timeframe may hold because it was a fresh single hit on a longer timeframe, which happened to line up with another index. The same method used on disparate vehicles helps avoid the problem of similarly derived indicators all showing the same thing compared to coincidental based level hits. Think steps vs ramps, gaussian vs Possian distribution, etc.
Attachments
%%+100 we don't predict, we react
Sounds like he found a good level on SPY;
''242.58,long when hit'' .NOT sure how that is any kind of prediction??
But good long term level on SPY...………………………………………………..Sounds more like an end of month trend #than n a prediction. Good support/level
342.58, my mistake.
well done what is your win% stockpredictor with your system ? cheers