If a day’s open on
DJX is above 281.47, long when hit
DJX is above 262.86, long when hit
SPY is above 242.58, long when hit
/RTY is above 1593.60, long when hit (Cash Open)
/RTY is under 1616.60, short when hit (Cash Open)
AMD is under 73.86, short when hit
AMD is above 86.97, long when hit
AAPL is under 124.85, short when hit
AAPL is under 99.27, long when hit
NVDA is above 537.57, long when hit
NVDA is under 515.37, short when hit
NFLX is under 466.46, short when hit
NFLX is above 525.55, long when hit
CAT is above 137.88, long when hit
BIDU is above 128.28, long when hit
BIDU is above 113.27, long when hit
BABA is above 276.03, long when hit
BMY is under 61, short when hit
JNJ is under 143.60, short when hit
JNJ is above 154.23, long when hit
TWTR is above 46.76, long when hit
TWTR is above 40.14, long when hit
JD is under 72.77, short when hit
TSLA is above 334.80, long when hit
TSLA is above 458.90, long when hit
UAL is under 30.72, short when hit
UAL is above 40.19, long when hit
BA is above 185.19, long when hit
BA is above 128.97, long when hit
FB is above 241.27, long when hit
SNAP is above 25.94, long when hit
SNAP is above 24.86, long when hit
VIX is above 23, long when hit
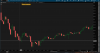
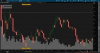
I've attached an example image on how to use these predictions. You can see that the Dow Jones opened ABOVE the level, and moved down to hit the level. It then reversed from there. This strategy typically works 80-90% of the time, regardless of market conditions. The signal can occur any time, any day, during next week. Watch and be amazed")
DJX is above 281.47, long when hit
DJX is above 262.86, long when hit
SPY is above 242.58, long when hit
/RTY is above 1593.60, long when hit (Cash Open)
/RTY is under 1616.60, short when hit (Cash Open)
AMD is under 73.86, short when hit
AMD is above 86.97, long when hit
AAPL is under 124.85, short when hit
AAPL is under 99.27, long when hit
NVDA is above 537.57, long when hit
NVDA is under 515.37, short when hit
NFLX is under 466.46, short when hit
NFLX is above 525.55, long when hit
CAT is above 137.88, long when hit
BIDU is above 128.28, long when hit
BIDU is above 113.27, long when hit
BABA is above 276.03, long when hit
BMY is under 61, short when hit
JNJ is under 143.60, short when hit
JNJ is above 154.23, long when hit
TWTR is above 46.76, long when hit
TWTR is above 40.14, long when hit
JD is under 72.77, short when hit
TSLA is above 334.80, long when hit
TSLA is above 458.90, long when hit
UAL is under 30.72, short when hit
UAL is above 40.19, long when hit
BA is above 185.19, long when hit
BA is above 128.97, long when hit
FB is above 241.27, long when hit
SNAP is above 25.94, long when hit
SNAP is above 24.86, long when hit
VIX is above 23, long when hit
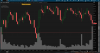
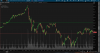
I've attached an example image on how to use these predictions. You can see that the Dow Jones opened ABOVE the level, and moved down to hit the level. It then reversed from there. This strategy typically works 80-90% of the time, regardless of market conditions. The signal can occur any time, any day, during next week. Watch and be amazed