Predicting gold and silver prices with trendlines and S/R!

As you know from my journal with live calls, I trade as if price is random.

As you know from following that journal, I bought some USLV the other day and am thinking about buying some gold, too.

Just for fun, let's try to predict the movement of silver and gold with trendlines and S/R.

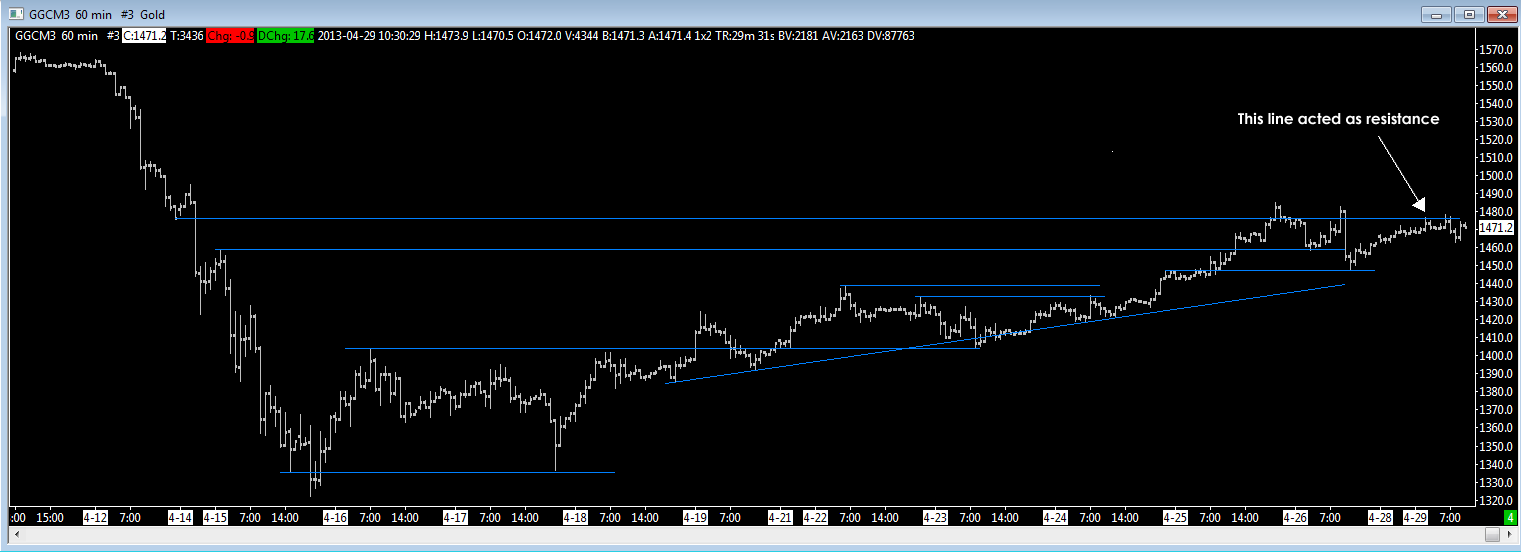
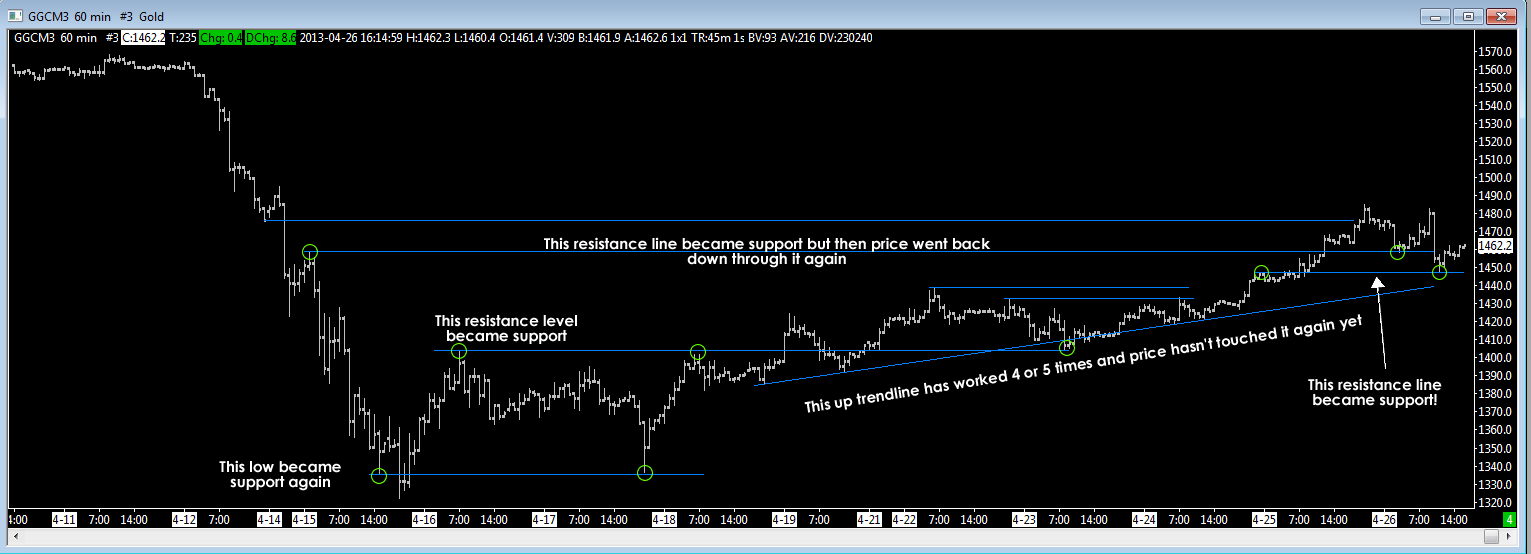
Here's a chart of gold since price dropped the other day:

Some of the lines seem to be working, and I've removed most of the ones that didn't to make the chart look better.
gold-sr-levels.png


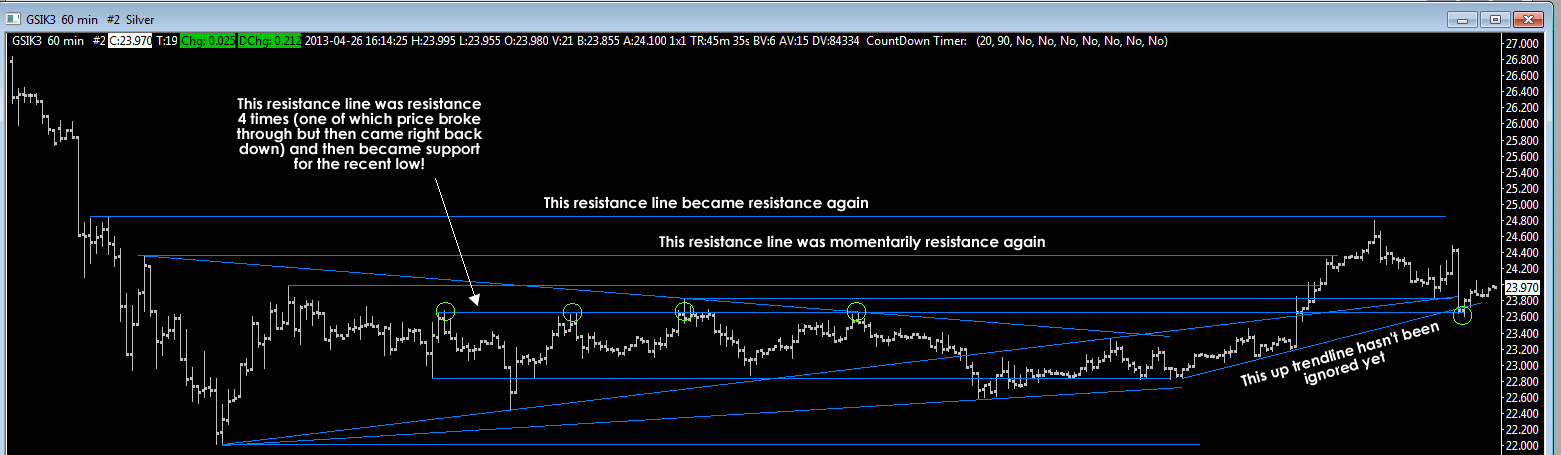
And here is silver:

silver-sr-levels.png


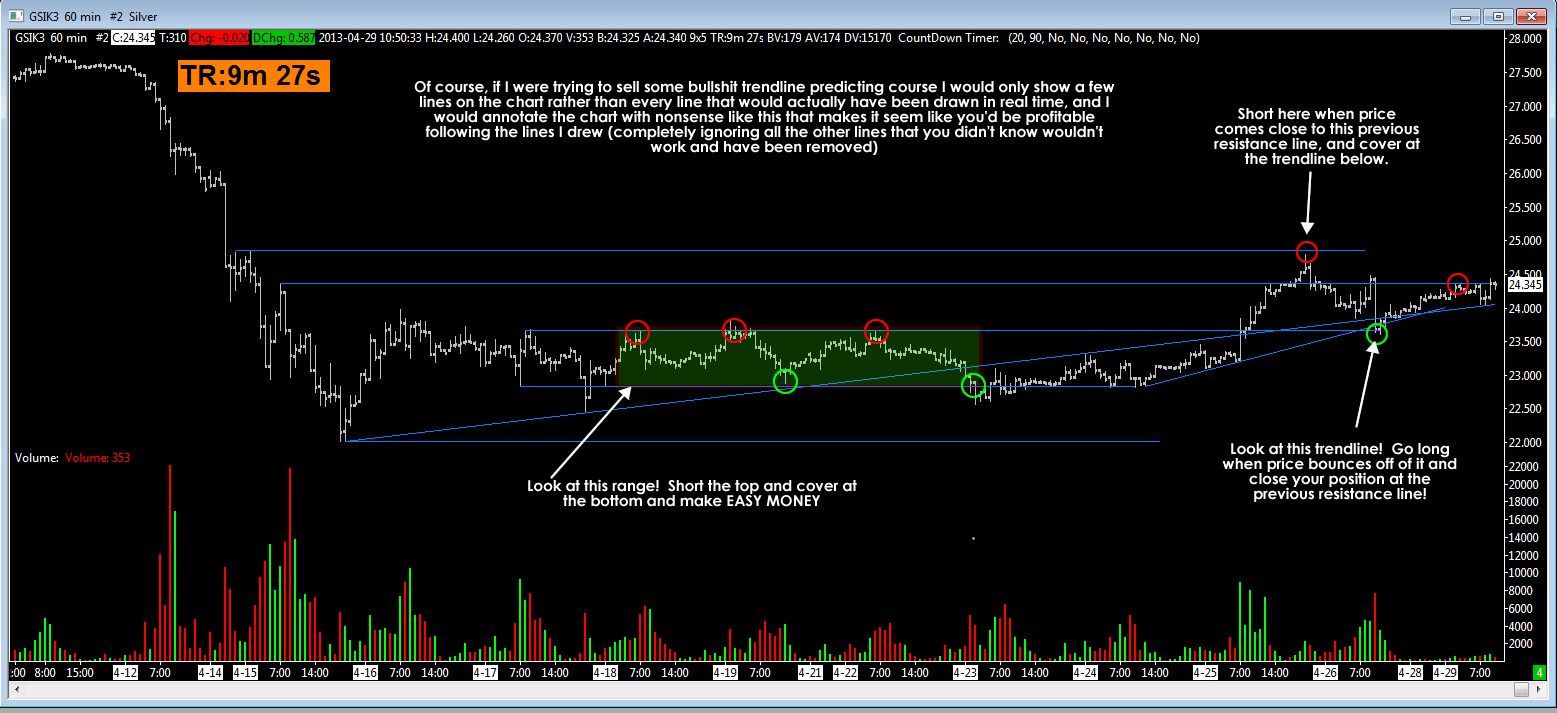
I drew a lot of lines because I had no way of knowing which ones would end up being useful or not.
 
Quote from 1a2b3cppp:
----let's try to predict the movement of silver and gold with trendlines and S/R.
----Some of the lines seem to be working....
----I've removed most of the ones that didn't to make the chart look better.
----I drew a lot of lines because I had no way of knowing which ones would end up being useful or not.
1) That's the "rub". It randomly "works" some of the time. :(
2) If you draw enough trendlines and support/resistance zones, something is likely to randomly "work". :eek:
 
S&R and/or lines both horizontal and diagonal = are context (and not the only context btw)

Context shows where, and how – participants acted

Context shows where “potentially” participants could act again – in either the present – or future

Context has no predictive value – iow; How…, or even if – participants will act – in either the present or future

Context is not a set up


Price could always respect…, deny/ ignore…, appear to deny/ignore then respect.., appear to respect then deny… become indecisive…, or show no interest in getting close to – our context


===================================================

We never (well at least I don’t);

Solely trade context…, or assume price will do something just because of context


Naz

I thought better of you than that old – put enough lines on a chart and something gotta work stchick


RN
 
Quote from Redneck:
----context....
----context....
----Context....
----Context....
----Context....
----Context....
----context....
----context....
----context....
----Naz....
----stchick....
Sir, I hereby grant to you the distinction of ..... Lord God Context Meister. :cool:
 
Quote from nazzdack:

1) That's the "rub". It randomly "works" some of the time. :(
2) If you draw enough trendlines and support/resistance zones, something is likely to randomly "work". :eek:

It's almost as if you're saying they're not reliable.

I wonder if the price predictors know this?

But seriously, that previous support is now acting as resistance for gold:

gold-sr-levels-2.png


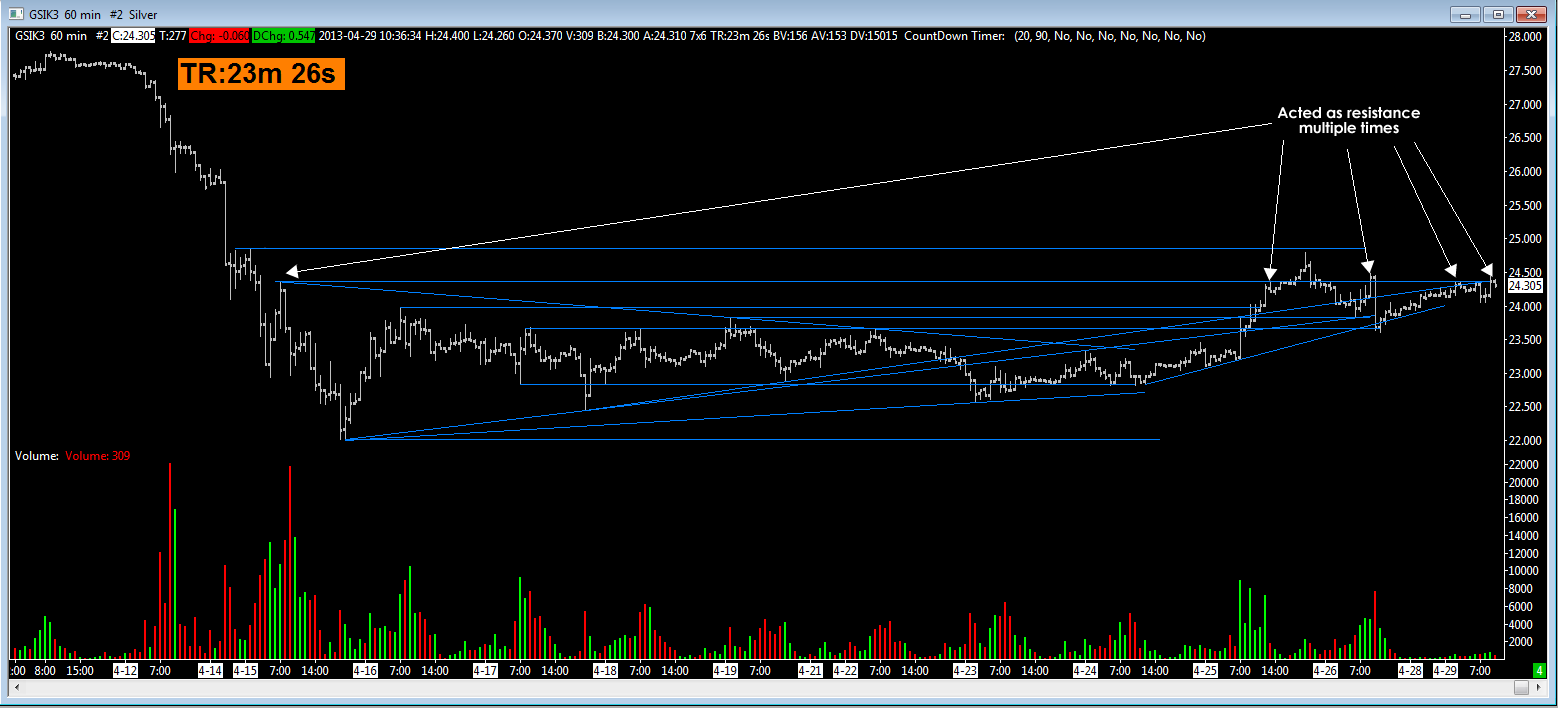
And silver:

silver-sr-levels-2.png
 
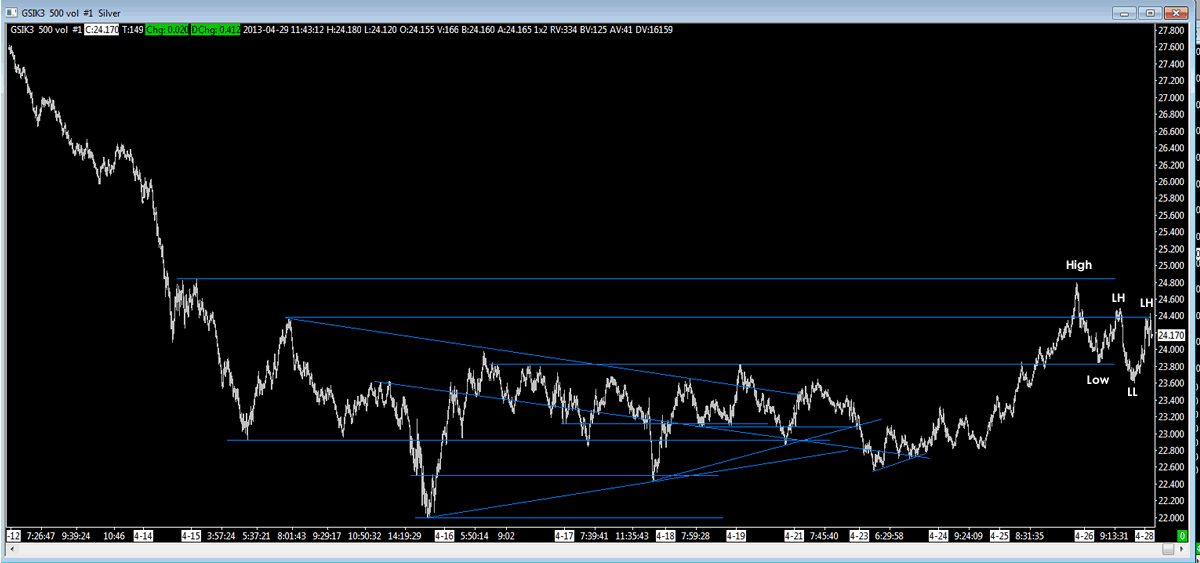
Silver is making lower highs and lower lows on a 500 volume chart:

silver-is-making-lower-highs-and-lower-lows.gif


Is this a downtrend? Should these pullbacks be shorted?

But wait until the next post for another way to look at it.
 
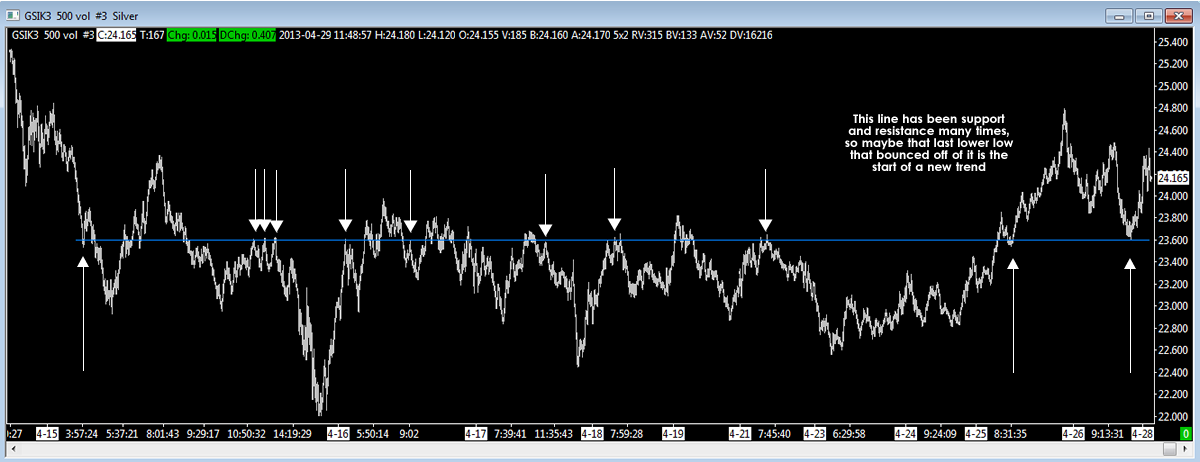
Look at this. This price has been S and R many times, and even though silver is making lower lows, the last one was right on the line so maybe it's going to make a higher high now rather than continuing its downtrend:

silver-big-sr-line.png
 
Quote from 1a2b3cppp:
----Look at this.
----This price has been S and R many times....
----last one was right on the line....
There are many places where the market crossed the "line" but you didn't draw arrows.....random application, random effectiveness. :( :)
 
Quote from nazzdack:

There are many places where the market crossed the "line" but you didn't draw arrows.....random application, random effectiveness. :( :)

I don't know if that counts. I've seen price action charts where price goes through a line and then bounces off of it again. Is that line still valid? If resistance flips to support price has to cross it at one point.
 
Back
Top