You are using an out of date browser. It may not display this or other websites correctly.
You should upgrade or use an alternative browser.
You should upgrade or use an alternative browser.
POST Some CHART Images in THUMBNAIL Format Right Here, Baby.
- Thread starter easymon1
- Start date
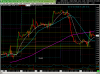
Natural Gas Trade Today. Long at Point A; Sold at Point B. This 2-hour chart lined up with what I was seeing on the daily too. Not every trade is this clean.

Lookin Good. You didn't do that on a phone did you? Hat's Off.Natural Gas Trade Today. Long at Point A; Sold at Point B. This 2-hour chart lined up with what I was seeing on the daily too. Not every trade is this clean.
View attachment 261042
rsid failure swing
https://www.elitetrader.com/et/thre...st-right-here-baby.335635/page-5#post-4929138
Attachments
Last edited:
No phone -- LOL. Just a small pic. Looks like your charts showed some similar perspectives. You can see both the support and the resistance.
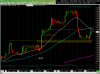
Here was my daily view (using UNG) for Natural Gas going into today. So we had resistance 2-days ago and then down to support area yesterday so was looking to buy today.

No, that wasn't on my screen, (dammit, lol) I look at NG at my end of day roundup and always appreciate traders who can pull some cash out of that product, but she's a bit wild and wooly for my blood.No phone -- LOL. Just a small pic. Looks like your charts showed some similar perspectives. You can see both the support and the resistance.
I post those NG charts in the spirit of trying to demonstrate that a good move will Often manifest signs and signals on an array of different methods.
Again, Hats Off To You FT. You got yours in the bag.
Thanks for the detail follow-up. Good Stuff.
What do you primarily follow? The trade I missed today was oil short. Late morning it started looking interesting and I got distracted and then it went down. I primarily follow S&P, Nas, R2000, Gold, Gold Miners, Oil, Natural Gas, Bonds and Bitcoin / Ethereum.
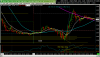
Here is what I was seeing in Oil. Wish I was in that one. Was tracking USO on a 130-minute chart -- sometimes I can see a particular market better on an index or ETF than the futures.

Bought gold off this low. We'll see what happens but looked really oversold in ST.
