I can build a chart, devoid of all foreign indicators (only price), that clearly displays support and resistance points in real time, as well as displays momentum like an HD TV.
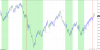
Here is the Micro Crude going into the close on Friday, the Sunday evening open and into the close today. The background color displays the momentum direction by reading the level of each price bar in real time; green down, white up.
Here we clearly see support and resistance, we see momentum direction and most importantly ew can see consolidation and where is comes out of it.
This is what naked price action looks like.
")
