Welcome to S&P 500 analysis. We are at very important level when we take a look at hourly, daily and weekly chart. I think next week we will se if new time highs are coming or it is just great opportunity for excellent shorts.
Below you will find updated charts of S&P 500 – on daily and weekly interval!
Welcome to S&P 500 analysis. We are at new all time high! Yes and still we can go higher – even up to 2280-2300 till the end of 2016. But we will see what happen. As always for day trader volatility and volume matter.
Below you will find updated charts of S&P 500 – on hourly, daily and weekly interval!
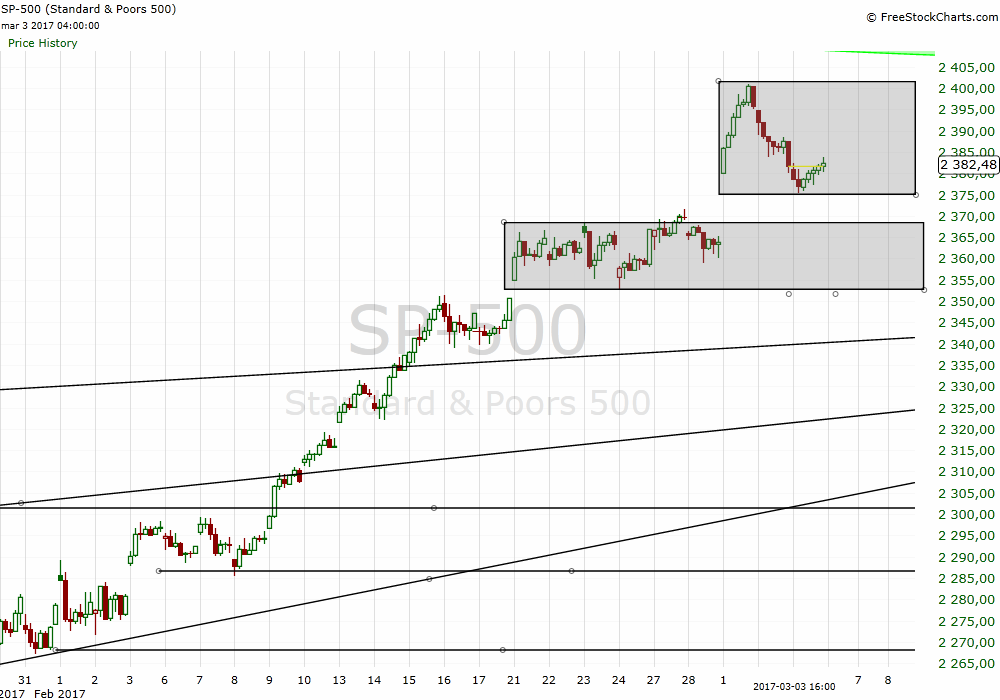
Welcome to S&P 500 analysis. Another new all time high on S&P 500. I think next stop is 2330. Then 2370.
Below you will find updated charts of S&P 500 – on hourly, daily, and weekly interval!