What will the report look like?Let's say I have a 5 day chart.
You are using an out of date browser. It may not display this or other websites correctly.
You should upgrade or use an alternative browser.
You should upgrade or use an alternative browser.
Plot Daily Highs on Intraday Chart
- Thread starter Ginu09
- Start date
It doesn't seem to work for a lookbackDays > 1Then, is this what you want?
input lookbackDays=1;
def ReferenceValue=high(period=AggregationPeriod.day)[lookbackDays];
plot PriorDayHigh=if (open(period=AggregationPeriod.day)<ReferenceValue) then ReferenceValue else double.nan;
PriorDayHigh.SetPaintingStrategy(PaintingStrategy.HORIZONTAL);
I'd just like a single line to show on the intraday chart for the first day high from the daily that is greater than the current day's open as an indication of overhead resistance.What will the report look like?
It's funny, I can get the code to work when I hardcode the "currentOpen = 1.24". However, if I use this code:
def currentOpen = if getTime() crosses above RegularTradingStart(getYYYYMMDD()) then open else currentOpen[1];
it fails. On a multi-day chart, when TOS goes through the various days on the chart, will currentOpen here store today's open only or the open of the day on the chart being evaluated?
def currentOpen = if getTime() crosses above RegularTradingStart(getYYYYMMDD()) then open else currentOpen[1];
it fails. On a multi-day chart, when TOS goes through the various days on the chart, will currentOpen here store today's open only or the open of the day on the chart being evaluated?
I think I am still guessing at what you want.
This just displays a horizontal line on the last day of an intra-day chart at the level of the highest bar of the day index provided as the input.
You may find someone that understands what you mean in the ThinkScript Chat on TOS. Some very clever folks on there!
input lookbackDays=1;
def ReferenceValue=high(period=AggregationPeriod.day)[lookbackDays];
def barRef=if ReferenceValue!=ReferenceValue[1] then barnumber() else barRef[1];
def plottime=barRef==highestall(barRef) ;
plot PriorDayHigh=if (plottime) then ReferenceValue else double.nan;
PriorDayHigh.SetPaintingStrategy(PaintingStrategy.HORIZONTAL);
--------------
If you provide some actual rendition of what you are doing, may go a long way for discovering what you are trying to do. A chart, with symbol, and your timeframe (none of which has been disclosed).
Do you have code which does something, and you wish it did something else and provide some hints?
Last edited:
I think I am still guessing at what you want.
This just displays a horizontal line on the last day of an intra-day chart at the level of the highest bar of the day index provided as the input.
You may find someone that understands what you mean in the ThinkScript Chat on TOS. Some very clever folks on there!
input lookbackDays=1;
def ReferenceValue=high(period=AggregationPeriod.day)[lookbackDays];
def barRef=if ReferenceValue!=ReferenceValue[1] then barnumber() else barRef[1];
def plottime=barRef==highestall(barRef) ;
plot PriorDayHigh=if (plottime) then ReferenceValue else double.nan;
PriorDayHigh.SetPaintingStrategy(PaintingStrategy.HORIZONTAL);
--------------
If you provide some actual rendition of what you are doing, may go a long way for discovering what you are trying to do. A chart, with symbol, and your timeframe (none of which has been disclosed).
Do you have code which does something, and you wish it did something else and provide some hints?
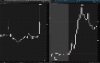
Here's an example in the attachment. I'd like to automatically display the first high from the daily chart that is greater than the open price from today (this move was from yesterday). Here the high would be 2.19 from 10 days ago with the open at 2.12. The duration of days (lookback period) can be anything and I wouldn't want to have to specify it ideally (who knows how many days ago the previous high would be).
For the code that you posted, I set a lookback period of 50 and it didn't post anything.
Hope that helps to clarify! and thanks for your help.
Attachments
Daily OHLCHere's an example
https://www.sierrachart.com/index.php?page=doc/StudiesReference.php&ID=137#Daily_OHLC