You are using an out of date browser. It may not display this or other websites correctly.
You should upgrade or use an alternative browser.
You should upgrade or use an alternative browser.
Please share your favourite time frames
- Thread starter victorycountry
- Start date
Nice quote, but I don't understand your answer lol."Hannibal Lecter: First principles, Clarice. Simplicity. Read Marcus Aurelius. Of each particular thing ask: what is it in itself? What is its nature? What does he do, this man you seek?
Clarice Starling: He kills women...
Hannibal Lecter: No. That is incidental. What is the first and principal thing he does? What needs does he serve by killing? "
Firstly, one have to determine what need do timeframes serve... In all you questions you missing the need...
I know why I use 15min / 1h/ daily / weekly and as you would say, I "need" them for my methodolody.
I just don't need the 4h because it doesn't give me much more information compared to the 1h and daily graph. But I can understand some people find it useful "for their needs".
CM
I am 100% sure using 1 min is useless for me, same for monthly and quarterly graphs.If u have what u need, then why to care what others using?
But 4h ? I don't know. I didn't really test it for a long period, so I am not sure if it could be useful or not for me.
If a real expert here could explain some advantages and not platitudes, of course I would be interested.
CM
If you're day trading futures you need a tick chart. Because you need to read order flow. How many trades per bar tells you the type of market you're trading. Short term traders v larger institution traders. A tick chart can tell you if the market is choppy which is bad for a day trader. Time frame charts help with understanding overall structure of the market. So you need both 5 min and 133 tick chart unless it's the ES which is huge volume so you need 1600 tick chart. And a 5 min.
If you're day trading futures you need a tick chart. Because you need to read order flow. How many trades per bar tells you the type of market you're trading. Short term traders v larger institution traders. A tick chart can tell you if the market is choppy which is bad for a day trader. Time frame charts help with understanding overall structure of the market. So you need both 5 min and 133 tick chart unless it's the ES which is huge volume so you need 1600 tick chart. And a 5 min.
I see ...so after all, the tick chart represents order flow .
Practitioners use different terminologies to academic researchers... we just call it order flow.
I remember nodoji who was active until last year mentioned the tick chart and she was saying that she does not monitor volume much and instead she follows the tick chart. Systemwiz's recently asked me whether I've conducted my research using the tick chart. But I'd no idea what the tick chart was although I see that there is an option to select tick chart on my time frames chart- which shows some kind of graphics
")
Now, I know...yep, I have done my PhD research using the order flow, volume, money flow data and find very significant results at 1 percent level. So after all, I am on the right track because I use A/D (instead of the tick chart) to monitor the order flow.
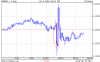
This Friday I was able to take a nice profit (the red circle) from EURUSD because on 1 Hour time frames, all my long MA (>50) were above the current price, indicating the market sentiment was bearish and there was an excess selling earlier on 1 Hour time frames too. I was only into 20 minute of US session, and I found another excess selling on the top of pullback (spike) on '1minute' time frame , so I initiated a short position immediately, and omg, within 2 minutes, it depreciated almost 80 pips..I closed my short position and went to bed straight away (because it was midnight in New Zealand time).
Attachments
Last edited:
Long Term Stocks/Commodities=Monthly/Weekly/daily/intraday for entries.
Options=Weekly/Daily/intraday
Swing Trading stocks=Daily/intraday
Day trading=hourly
Scalping=One minute
Each timeframe does something else.
After all, since I use 1 minute time frame, I am a scalper too.
When I was studying some old ET threads, some members made negative comments on scalpers. But I kind of understand now because that time, some traders were not used to fast tradings.
There were many times I left my position open even though I had a number of opportunities to take a nice profit and eventually lost all those profits. So I started to think that FX market might be different to stock markets. FX market is very sensitive to price changes because of import/export and bond derivatives etc. so unlike stock markets, in FX, a trend may not be able to persist long time . That's when I started to use 1 minute timeframe. After all, high frequency traders dominate financial market these days so it makes sense to use 1 minute timeframe too.
By the way, I hope your trading is not affected by the recent incident in Texas...
Have a nice weekend, Handle123
Last edited:
By the way, I hope your trading is not affected by the recent incident in Texas...
Have a nice weekend, Handle123
Texas on Interstate 10 is 882 miles long, I live in West Texas and is bout 625 miles from where I live, so although still in Texas, pretty far away. My heart and prayers goes out to families of the slain and injured.
Only daily timeframe. Higher timeframes can be modeled in daily TF and below will cost money, so no. Have tried esignal before and might pay for it again if trading can pay for it. Think I'll be better equipped for intraday trading now than before, but don't have the time and motivation yet.