%%
That sounds better than the WSJ-they use 65d ma + 2oo dma.
I Prefer 200 dma myself.....
It allows me to see trends and channels without drawing a single line, very useful.

%%
That sounds better than the WSJ-they use 65d ma + 2oo dma.
I Prefer 200 dma myself.....
Am I the only one who thinks that asking people to "share their favourite moving average levels" is just like going into the lobby of a hospital and asking people to "share what their medication is", without knowing what illnesses they have or what dosages they're taking and why - and that it's about as informative, too?
Am I the only one who thinks that asking people to "share their favourite moving average levels" is just like going into the lobby of a hospital and asking people to "share what their medication is", without knowing what illnesses they have or what dosages they're taking and why - and that it's about as informative, too?
I have shopping bag full of medications, vitamins and supplements, how long do you have to copy all of them? LOL


Being this is a forum to exchange ideas, and folks show what they use, maybe it will trigger for more dialog. Very few of the posts here on forum have much to do with what actually works, I think it is refreshing to see what others use myself. Like 95% on this forum is more of opinions and dialog bad mouthing others, or maybe it is me and I don't see too much useful information any more. I do think it better to show charts of whatever one uses which can get their point across better.
Nice that IronFist put in Post from the past of other ideas of what might work.
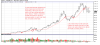
This is how I use 18sma on monthly charts, shows trend but more importantly shows me when I should STOP taking trades. I actually use this kind of chart for one method of trading options, when price hits ma, I can do Credit Spreads and as higher lows each month, can continue to do Put credit spreads, if price hangs near that ma for two months in a row, time to find another stock/ETF.