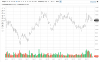
I did my TA for swing trading TLT and I'm getting very murky results. There's a larger downtrend, of course, for the bond market but it's either changing direction or forming a rising wedge right now. That being said, I'm looking at swing trades that can last between 2 days and 2 months depending if the TA keeps me in or not. I won't say too much about my own TA because I don't want to skew what other people post. Can anyone tell me what they think is happening with TLT in the near term? About to have a bullish breakout or hitting the final resistance with a triple-top and the bear market resumes for bonds? (Daily chart for 6 months)

You are using an out of date browser. It may not display this or other websites correctly.
You should upgrade or use an alternative browser.
You should upgrade or use an alternative browser.
Phone a friend - TA help with this chart
- Thread starter Radiohead
- Start date
Did you purposely forget to state what you're
willing to pay for this service?
Capitalism is King
Feeling generous, I'll give it to him for free...
TLT is in a trading range. Bottom of range is 100-ish. Top of range is 110-ish. The technically correct strategy is to "buy the bottom of the range support and sell/short the top of the range resistance". All else is noise.
If I've saved you some money and you'd like to reward my generosity, please donate a few bucks to a nearby no-kill animal shelter.
That's a 6 month range chart, it might help to use multiple time frames
to determine when there's a break in market structure.
Technically, he's using the wrong time frame for the conditions
of a Swing trade between 2 days and 2 months. He needs
more info, and therefore more time frames to make a decision.
He should be on a Daily, 4 hour and 1 hour chart for the conditions
he's looking for.
I will be sending my invoice in the mail!
I pretty much disagree with you on all points... but I hope you get paid anyway.
")
A difference of opinion is always a good thing for the markets to thrive.
The only thing that matters is "the last significant thing the market does" and your reaction to it. All the rest is irrelevant. The things you mentioned are all irrelevant. (I didn't mean to be mean-spirited and critical... just thought I might direct you to "better think" for trading.)
The only thing that matters is "the last significant thing the market does" and your reaction to it. All the rest is irrelevant. The things you mentioned are all irrelevant. (I didn't mean to be mean-spirited and critical... just thought I might direct you to "better think" for trading.)
Hi Scataphagos,
I did not think your response was mean spirited at all.
And I never take such things personal.
As a strictly PA trader, I use multiple time frames in all my trading.
And as always, appreciate the advice!
Last edited: