i use mp and a lot of times it overrides the smaller time frames s/r and you go to a larger timeframe and you see them, do you have the same problem with ew,i included a monthly chart would some ew'er be kind enough to draw the past waves in,a,bc and 1 thru 5Quote from Wide Tailz:
Decision time. Wave 4 typically does not go below the fourth wave of the previous impulse wave. Notice the horizontal support on all the major indices?
If we go any lower, Bernanke and The Bulls are going to be in serious trouble.

You are using an out of date browser. It may not display this or other websites correctly.
You should upgrade or use an alternative browser.
You should upgrade or use an alternative browser.
Perfect Wave - 2012-1/2
- Thread starter snowrider
- Start date
Quote from ammo:
i use mp and a lot of times it overrides the smaller time frames s/r and you go to a larger timeframe and you see them, do you have the same problem with ew,i included a monthly chart would some ew'er be kind enough to draw the past waves in,a,bc and 1 thru 5
ammo - I set up my blog last week and posted some possible long term counts in the archive. Some of them are out-dated but still worth taking a look. Note that my wave counts have grey line and purple line so you can see the wave from different perspectives. Thanks.
Quote from Wide Tailz:
Decision time. Wave 4 typically does not go below the fourth wave of the previous impulse wave. Notice the horizontal support on all the major indices?
If we go any lower, Bernanke and The Bulls are going to be in serious trouble.
Wide Tailz - Yes, I agree that wave 4 is a critical support. The market looks so far so good. I will still be cautious. My portfolio has loaded tons of TLT, FAZ, and EDZ for my long term trade (published on my blog) and some short positions on GC, SP, EUR for short term.
Quote from ScalperJoe:
Yes, the horizontal support is definitely holding it up. Also, the market is almost equally distant from the top of Wave 3 (1,422) and the top of Wave 1 (1,293), thus causing a very choppy and rangebound current pattern. It's a classic struggle between the bulls and bears.
No need for the bulls to worry though, Uncle Ben's got his helicopter ready, and will be flying all over dropping freshly printed fiat currency like leaflets in a war zone!
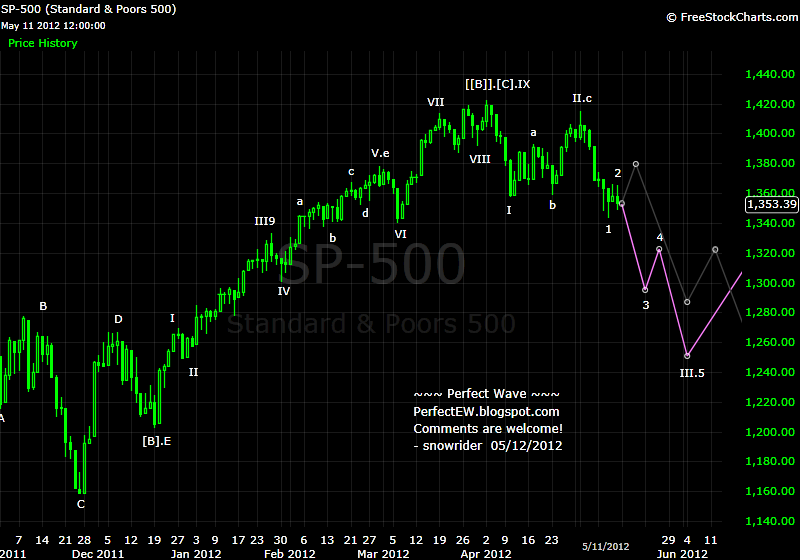
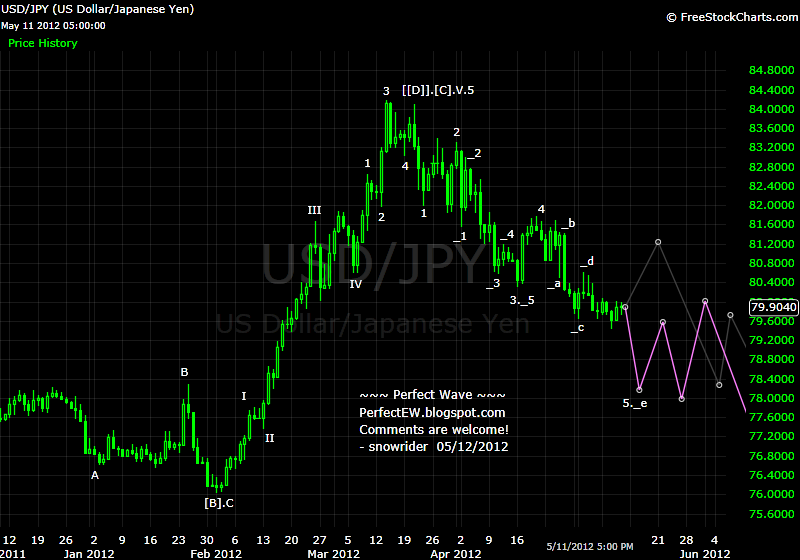
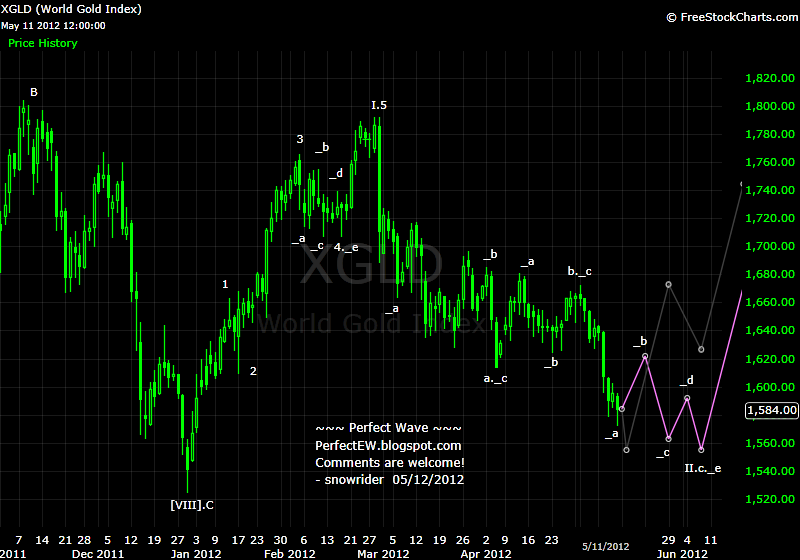
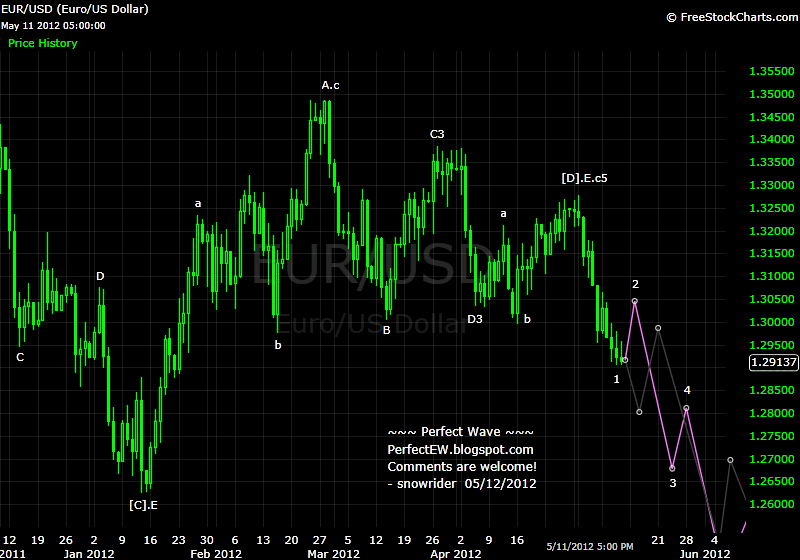
ScalperJoe - Currently a possible wave count is in the abc wave 2 bounce from Wednesday's low. If this is the case, after this wave 2, next monday could be a big gap down.
Quote from bwolinsky:
Can someone build a backtest on EW?
If not, then there is no method.
bwolinsky - I remember that we have talked about this before. Trading is not a science. Trading with EW is more than an art. If you are trying to find something guaranteed, there is no such thing. I set up a blog last week and started posting my trades for long term timeframe in real time there. You are welcome to see for yourself to verify whether EW worth your time.

Quote from snowrider:
ScalperJoe - Currently a possible wave count is in the abc wave 2 bounce from Wednesday's low. If this is the case, after this wave 2, next monday could be a big gap down.
Good call, and the SPX breached the March low and closed below 1,340. So for the current wave count to remain intact, the third wave of [IV] cannot breach 1,293 (Wave top), is that correct?
Quote from ScalperJoe:
Good call, and the SPX breached the March low and closed below 1,340. So for the current wave count to remain intact, the third wave of [IV] cannot breach 1,293 (Wave top), is that correct?
Yes, that is correct! If we count the high of 10/27/2011 as the ending point of wave-, the current pull back should not fall below that point. In other words, wave-[IV] and wave- won't overlap.