
You are using an out of date browser. It may not display this or other websites correctly.
You should upgrade or use an alternative browser.
You should upgrade or use an alternative browser.
Perfect Wave - 2011-Q4
- Thread starter snowrider
- Start date
the blue dotted line from prev chart is at the top of page above 1375 and was tagged earlier this year ,reduced we have started the descent on the large hns (the whole chart)the neckline from the red circled smaller hns comes in around 1292,if we pop next week and i don't think we will according to open interest in dec spy options,that 1292 should /could be res..
Attachments
Quote from ammo:
the blue dotted line from prev chart is at the top of page above 1375 and was tagged earlier this year ,reduced we have started the descent on the large hns (the whole chart)the neckline from the red circled smaller hns comes in around 1292,if we pop next week and i don't think we will according to open interest in dec spy options,that 1292 should /could be res..
ammo - Thanks for sharing your thought. I appreciate that.
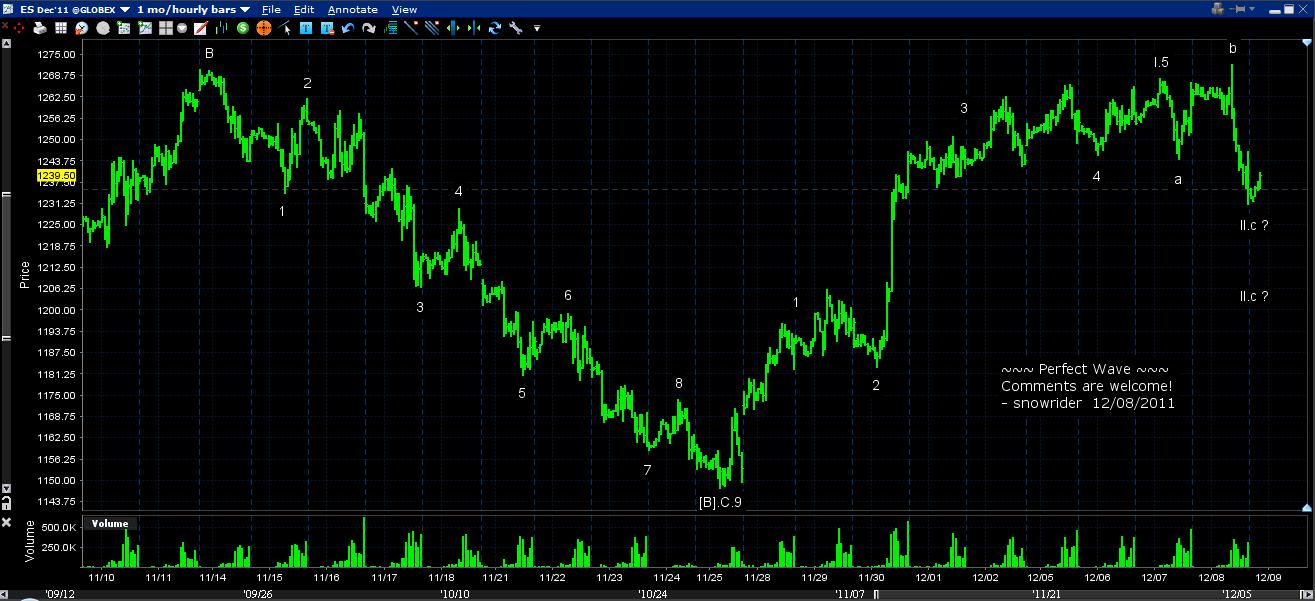
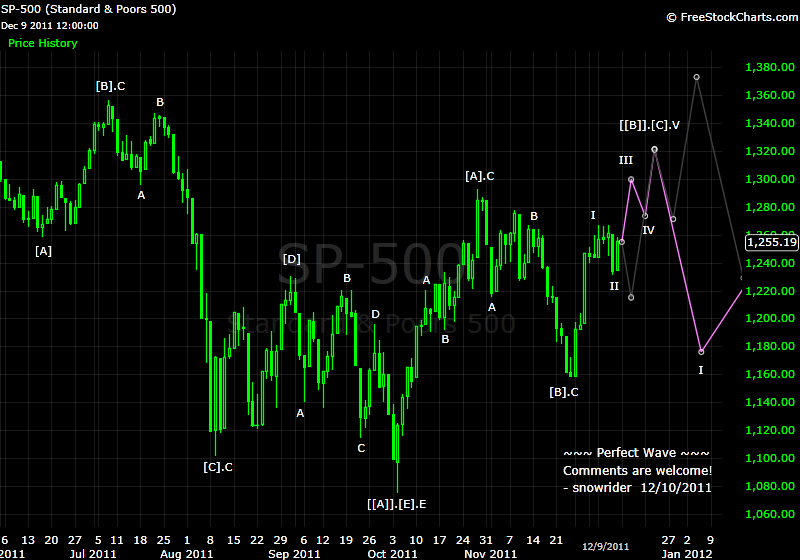
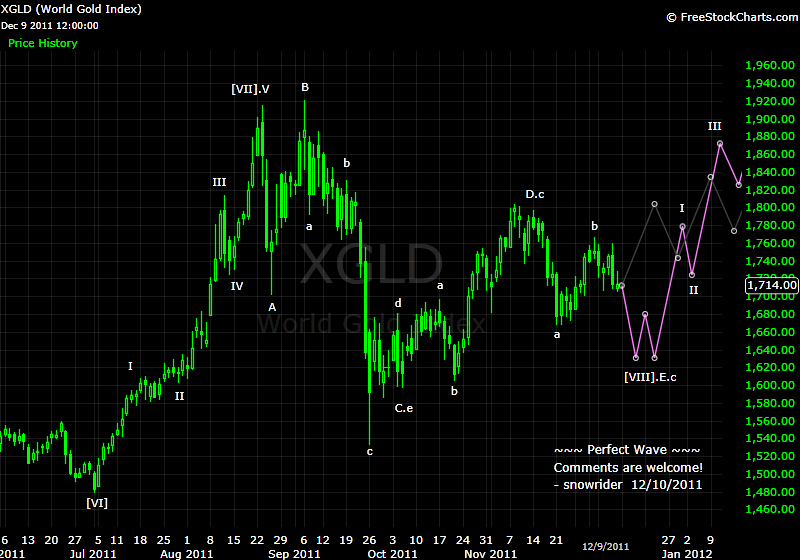
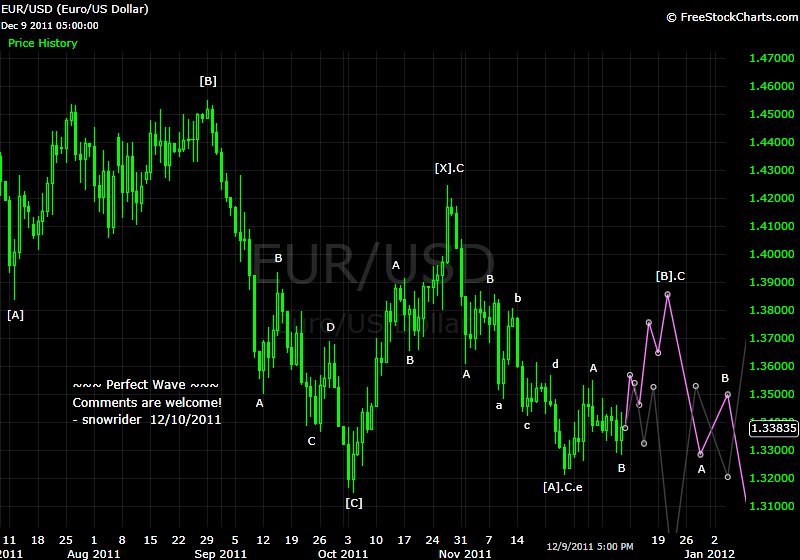
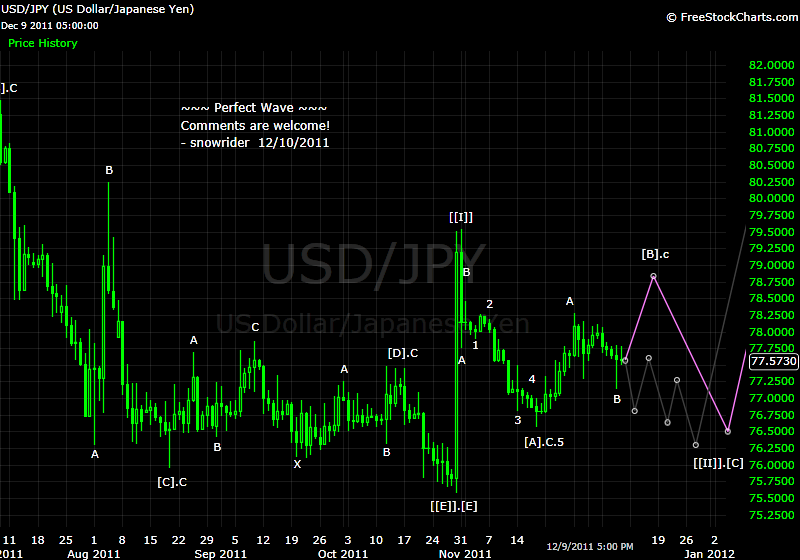
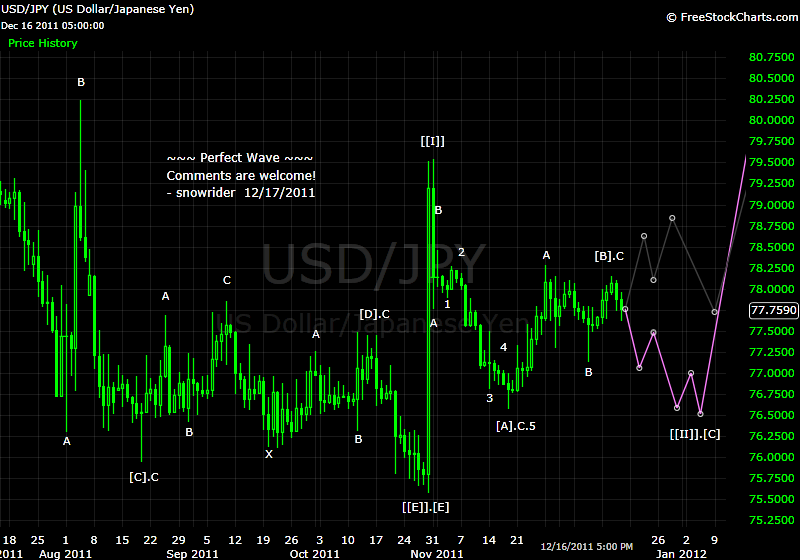
yupek - Thanks for reading my weekly posts. My prediction is based on the Elliott Wave principle that everyone can find tons of references on the web. About last week's prediction, say SP for example, my preferred count is the purple line. The market could have taken wave-II right away last Monday. In that case, wave-I.4 would be a simple correction. However, the market went flat for 3 more days, and wave-I.4 became a complex correction. Last Thursday's sell-off could be the final kick of an irregular wave-II before wave-III's marching north.Since you post the chart every week, is it ok to have some comments about the last week's prediction, if it is good, and if not, how you adjusted to it, etc. I think that it will be much appreciated. Thanks.
...
It's hard to answer the question about how to adjust wave count. If one wants to trade EW, at any moment, s/he needs to have a backup plan - that is the alternative count. When the market does not move in favor of one's preferred count, the alternative count may become the preferred one. Remember one thing ... anything can happen. Therefore, trading with EW is a process of constantly thinking. As I mentioned many times, it's just like playing chess with the market. I don't mind to share my view every weekend because I will be happy if readers make money and also share their thoughts with me. More people watch the game (of chess), more thoughtful the wave count would be.
yupek - Yes, it is possible (and anything is possible). Please see the grey line alternative count. Also I explained that as a micro alternative count in last Thursday's posts. Say, if you have bot SP at Thursday's MOC, now your STP order can be placed 1 point right below last Thursday's low. If the STP gets hit, you don't lose nothing. We don't know if it will happen, but when an opportunity comes, one needs to evaluate if it is worth the risk to bet. Say, if you did not enter the long of SP at Thursday's MOC, when do you want to enter? After breaking out weekly high? Not really a good idea because once it happens, where are you going to place your STP order? It will be the same price (1 point right below last Thursday's low), but your risk will be much higher.Thanks for comments. It is very helpful.
I just feel that Thursday's correction is too shallow. It is still possible that we have two legs down. So we may revisit Thursday's low or even go to 1220. I'm wondering why you think that we should go up from here.
...
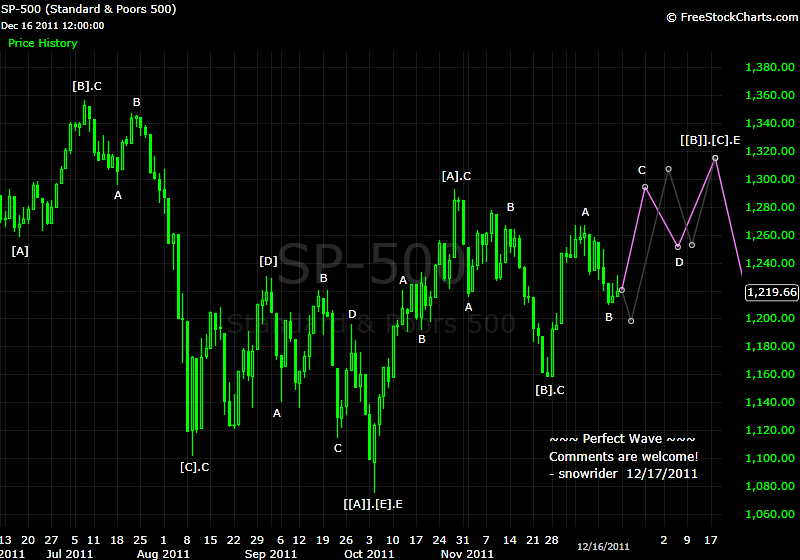
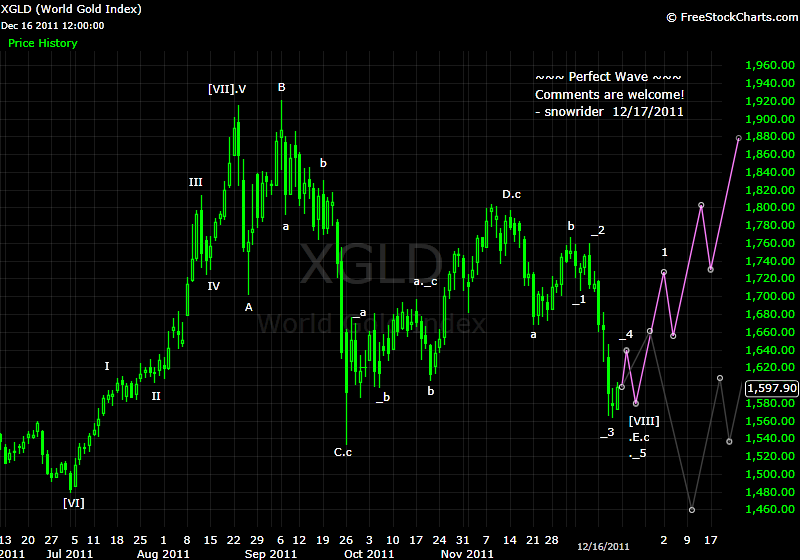
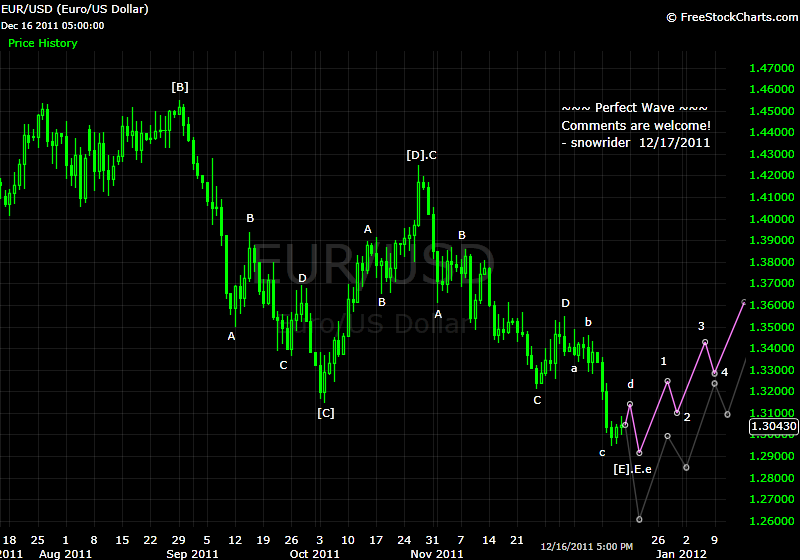
yupek - I assume that you are talking about SP. Yes, it could break "the current big triangle" (as I believe that anything is possible). I did not mean to ignore that scenario, but I just did not want to draw a spiderweb on the chart to include all possible scenarios. You might want to ask why I favor those up scenarios over down scenarios? Last week's low is 50% pullback, and 1200 area is 61.8% pullback. There is no reason to assume that the market is weakening and going down before some key fibonacci ratios stop working.So the basic impression is: we will find a bottom soon (it may have been there, or a little lower than last week's low), and go up to pass the MA 200.
Just wonder why you ignore the possibility to break down from the current big triangle (breaking 1200).
...