
You are using an out of date browser. It may not display this or other websites correctly.
You should upgrade or use an alternative browser.
You should upgrade or use an alternative browser.
Perfect Wave - 2011-Q1
- Thread starter snowrider
- Start date
Quote from 1a2b3cppp:
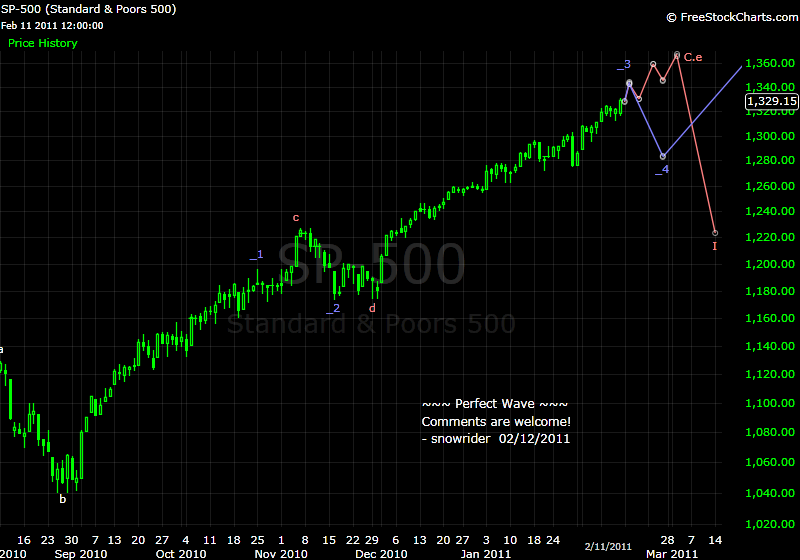
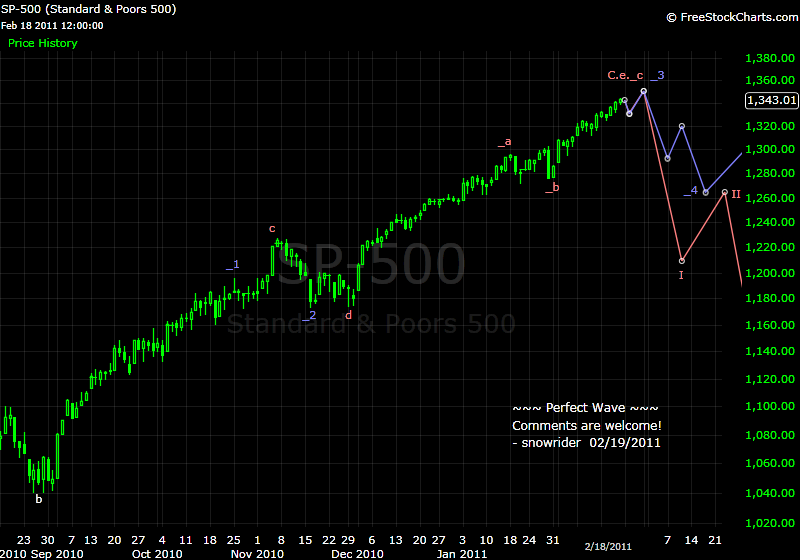
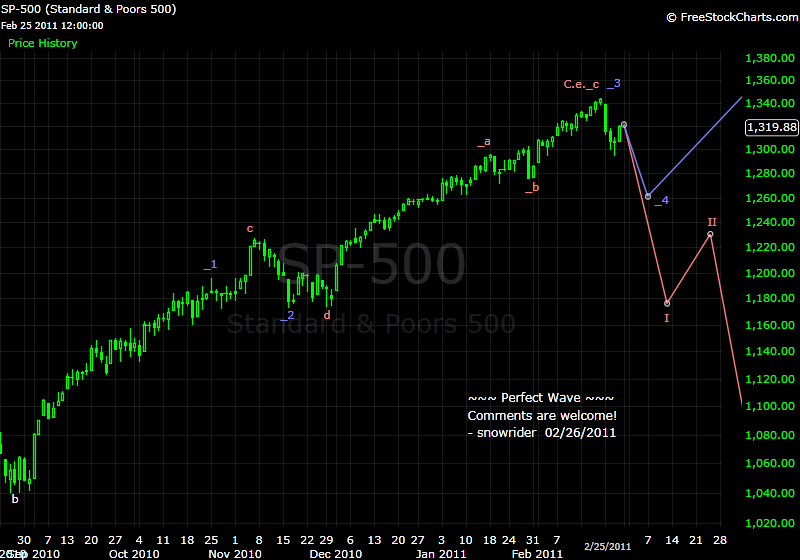
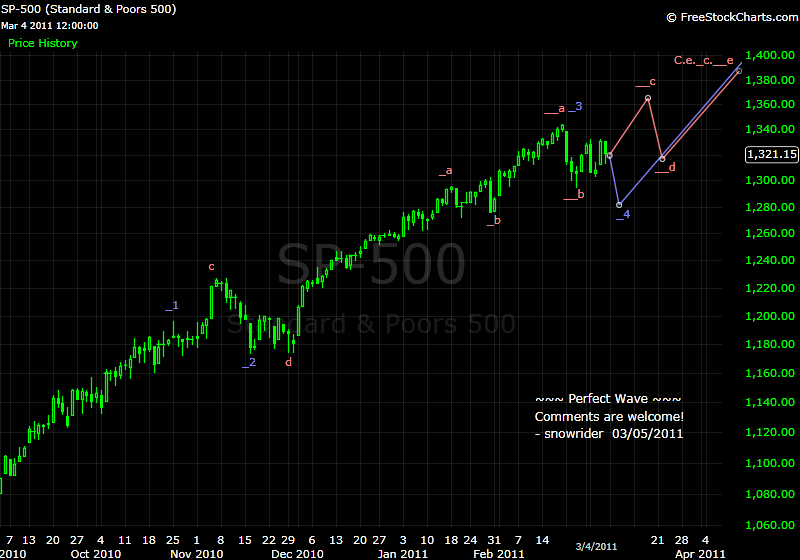
I'm only looking at the ES charts, but why is there so much difference between each chart? How do you know when to draw a new one?
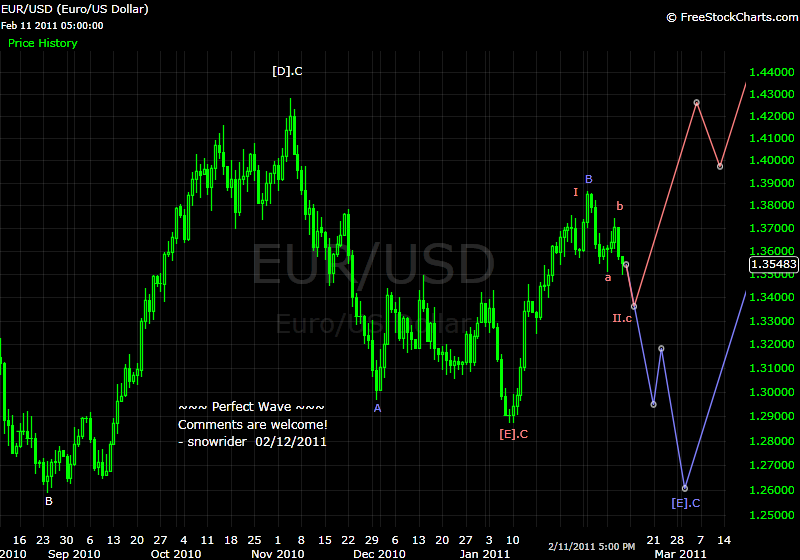
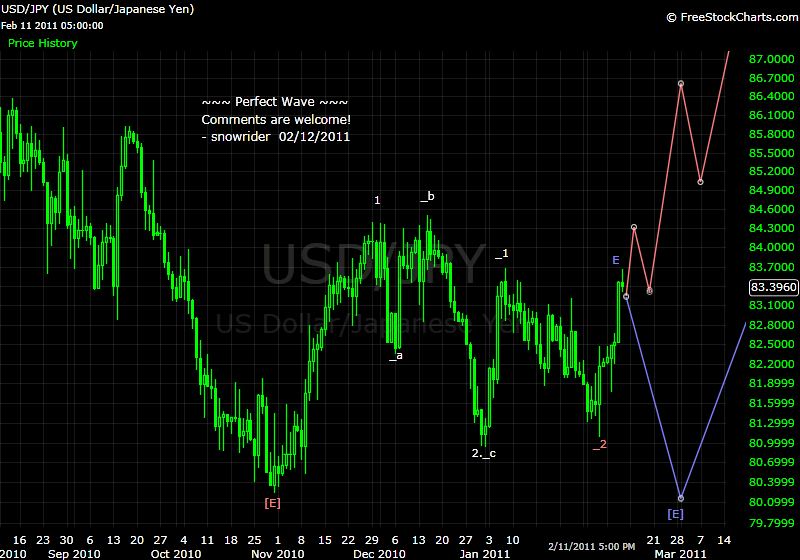
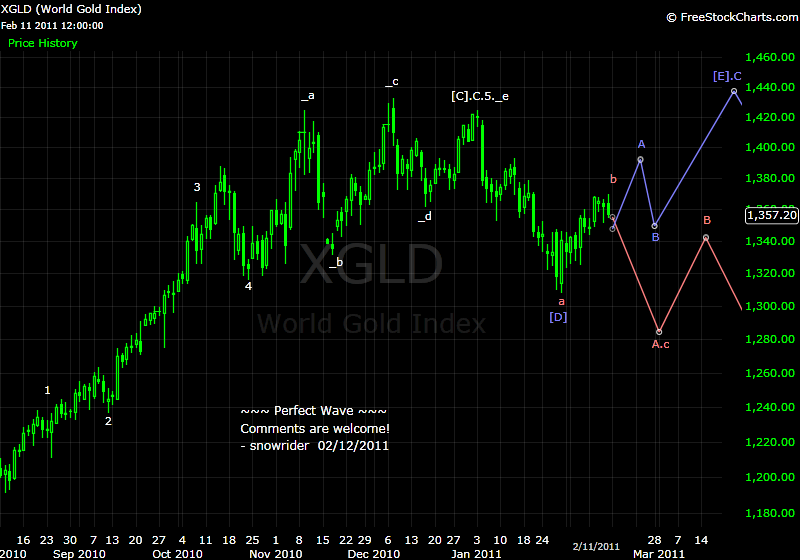
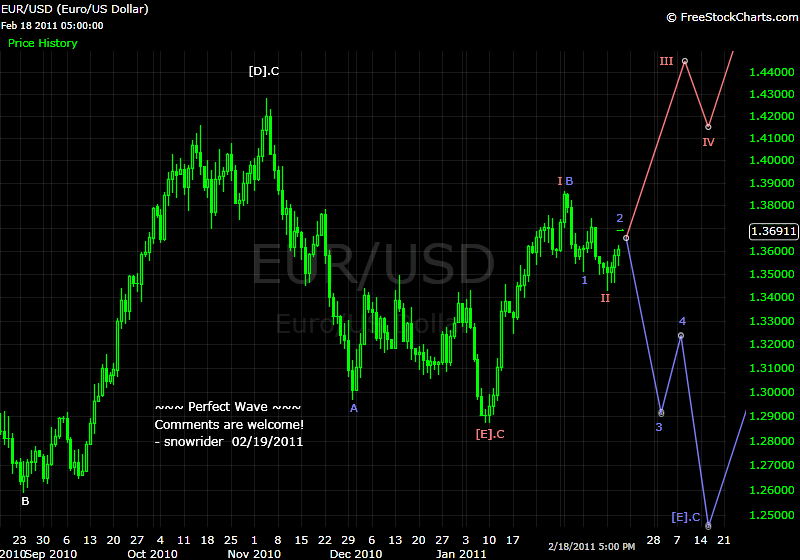
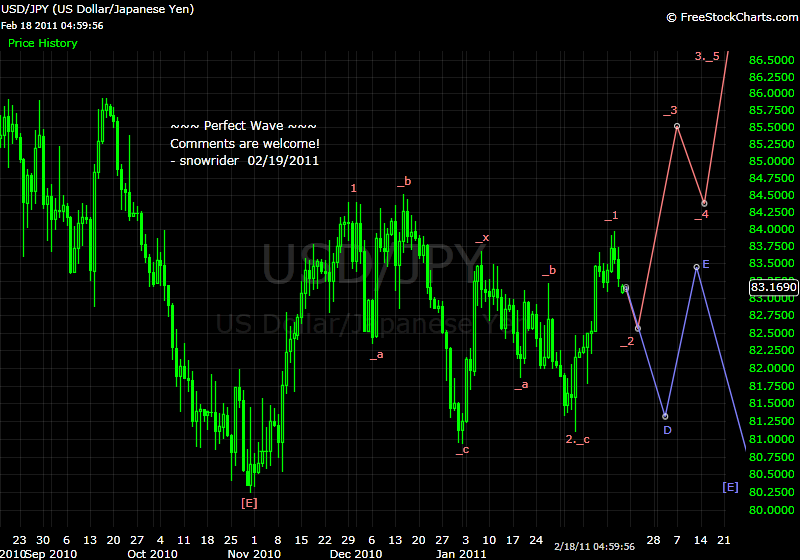
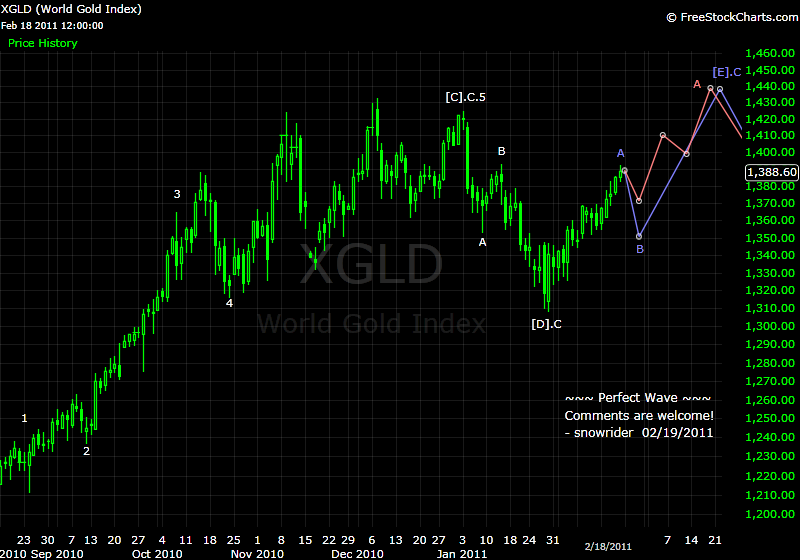
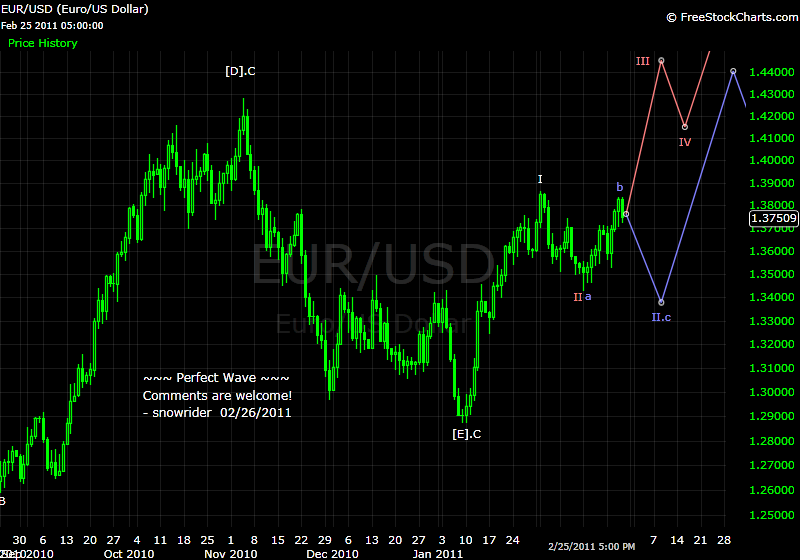
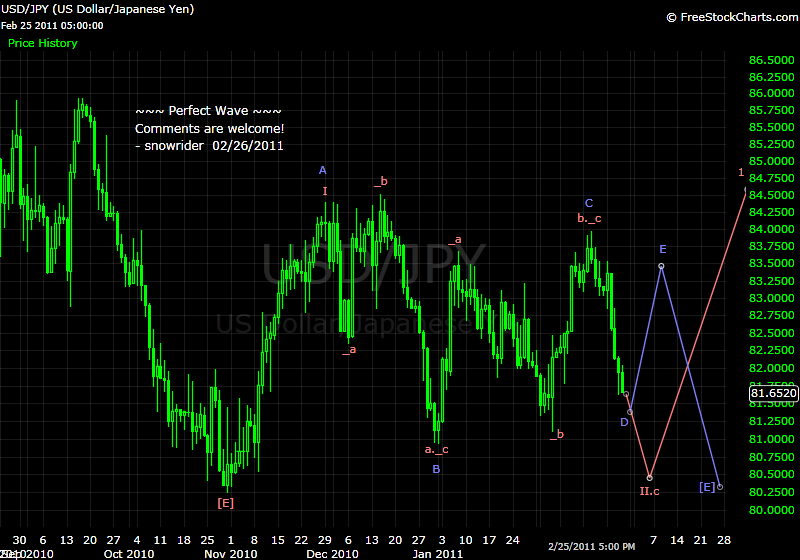
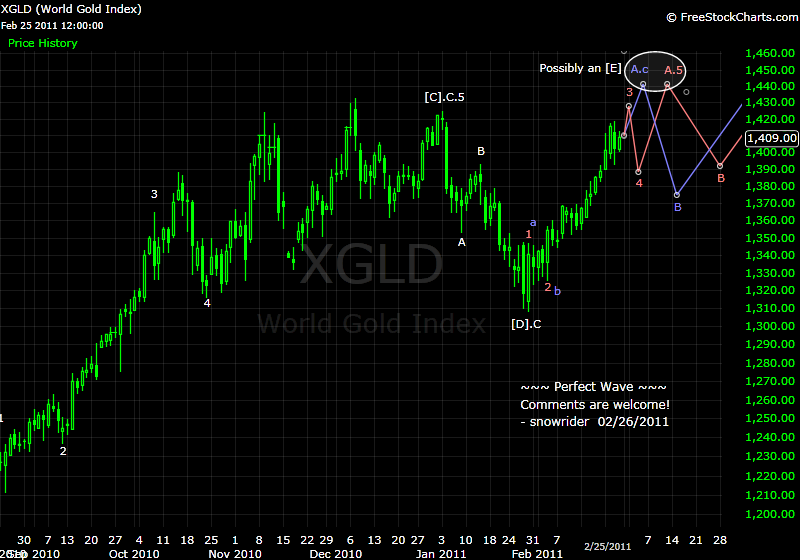
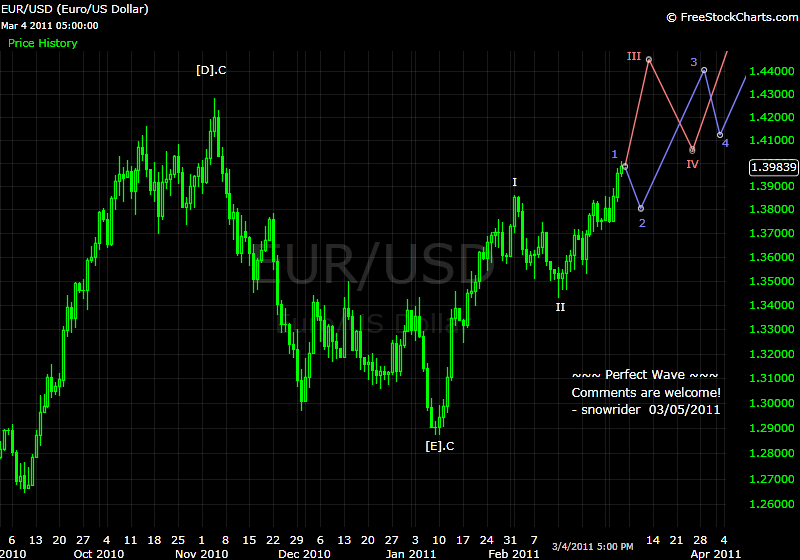
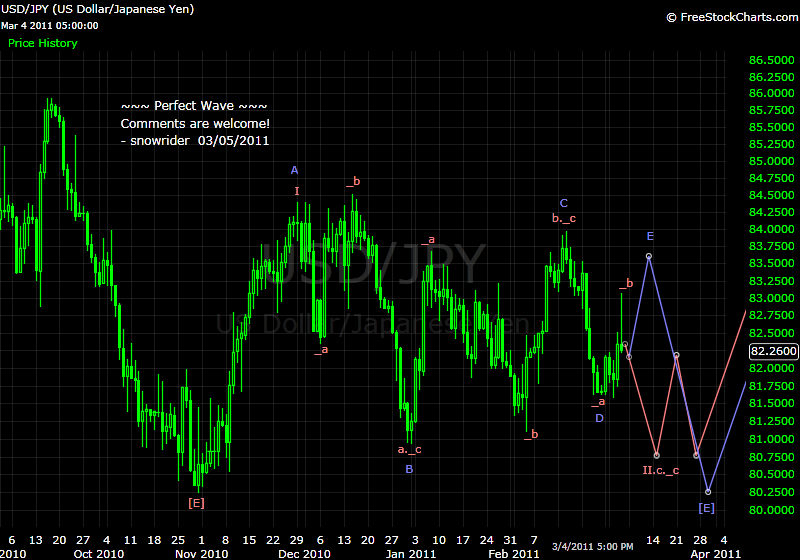
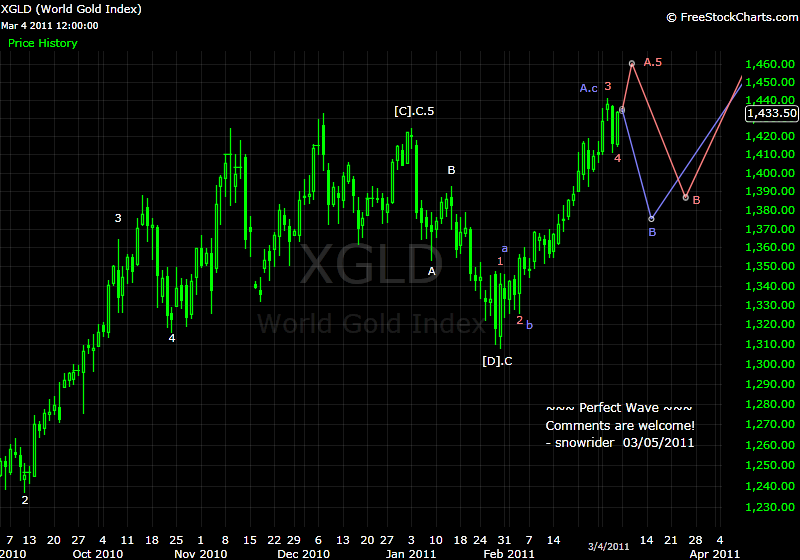
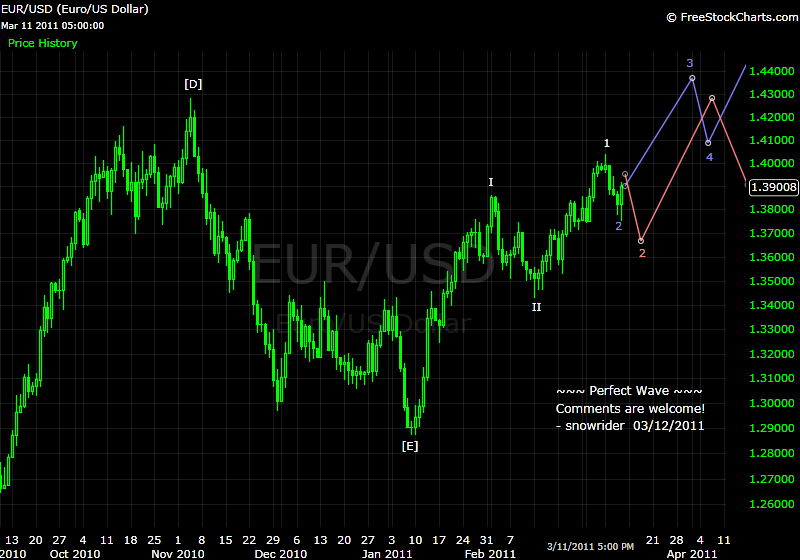
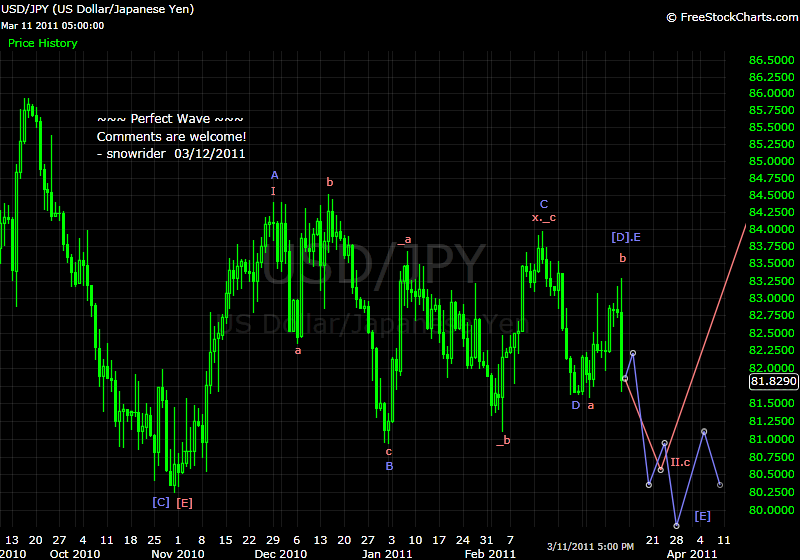
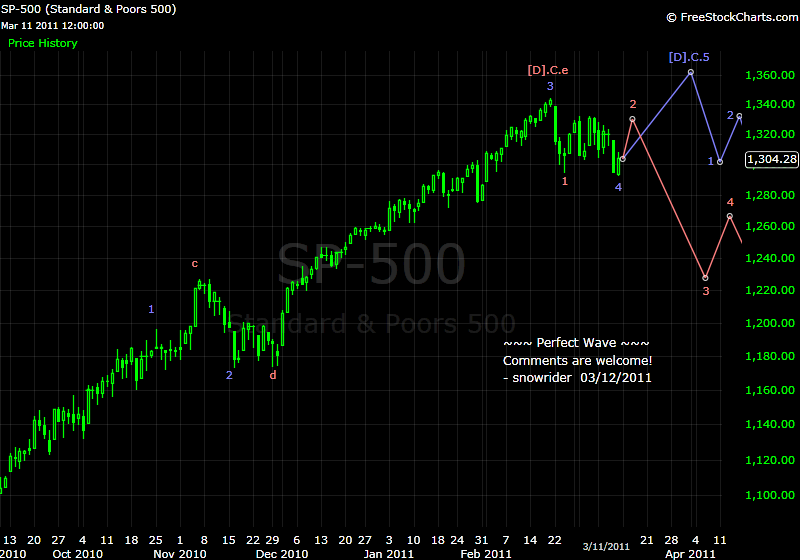
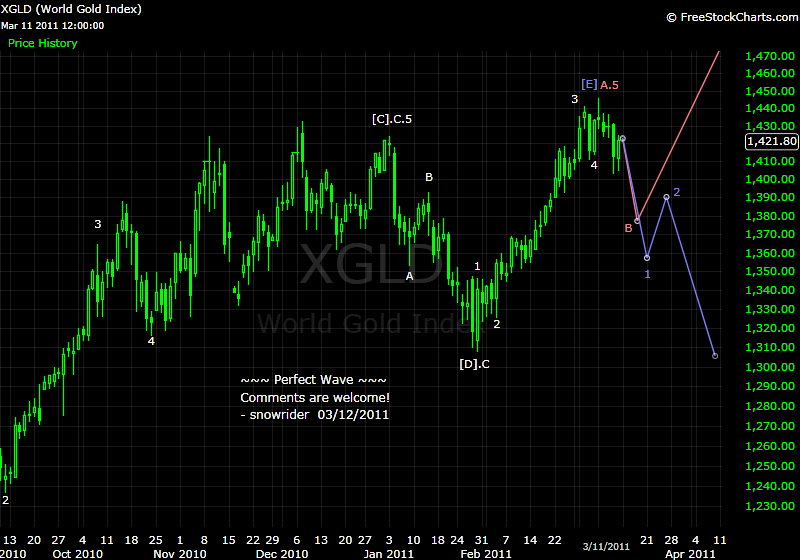
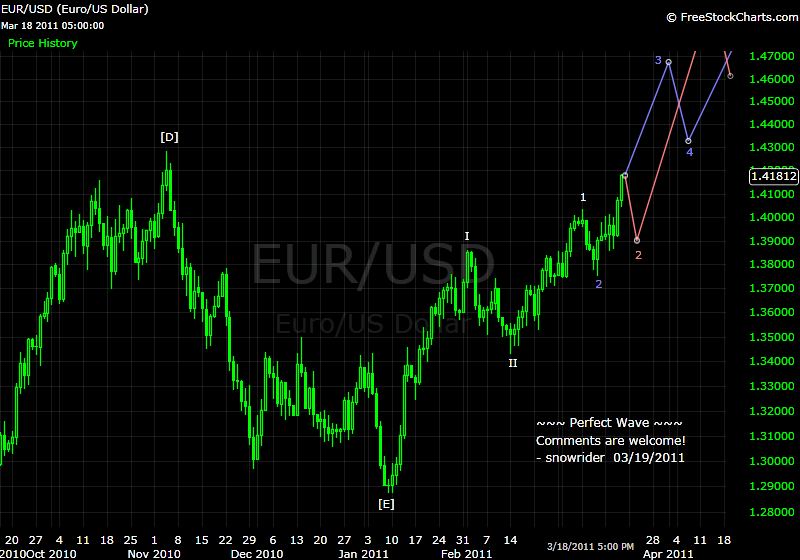
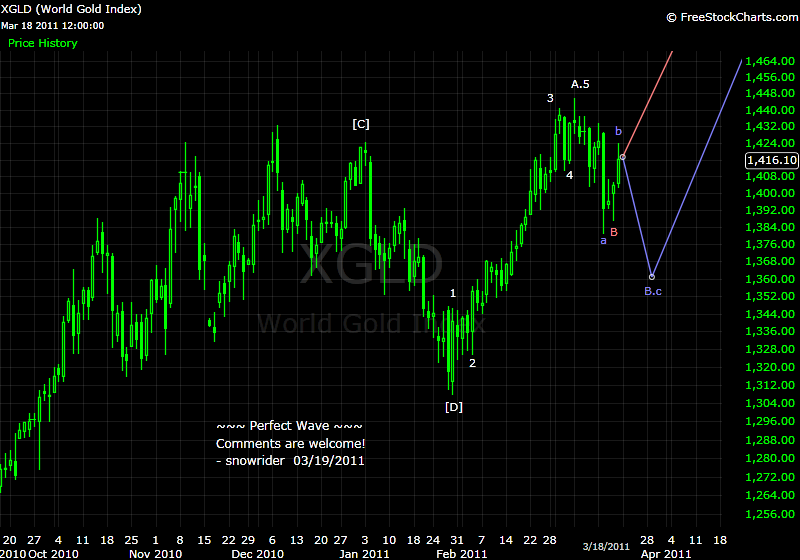
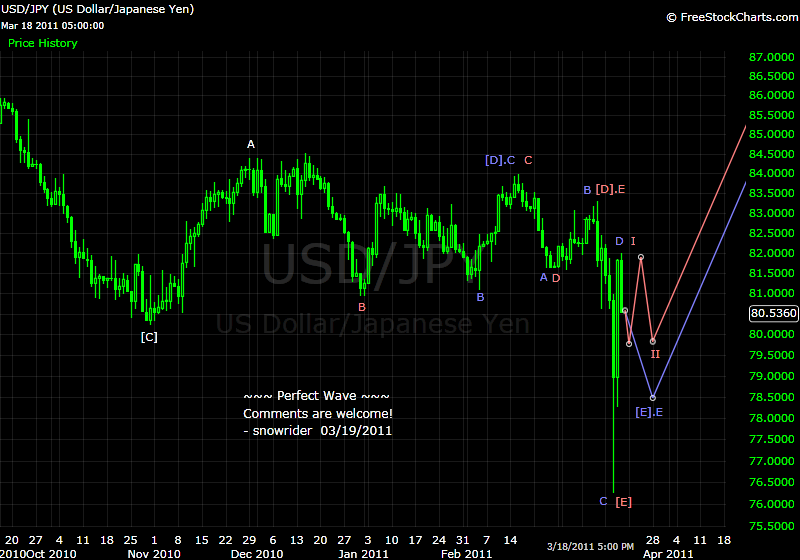
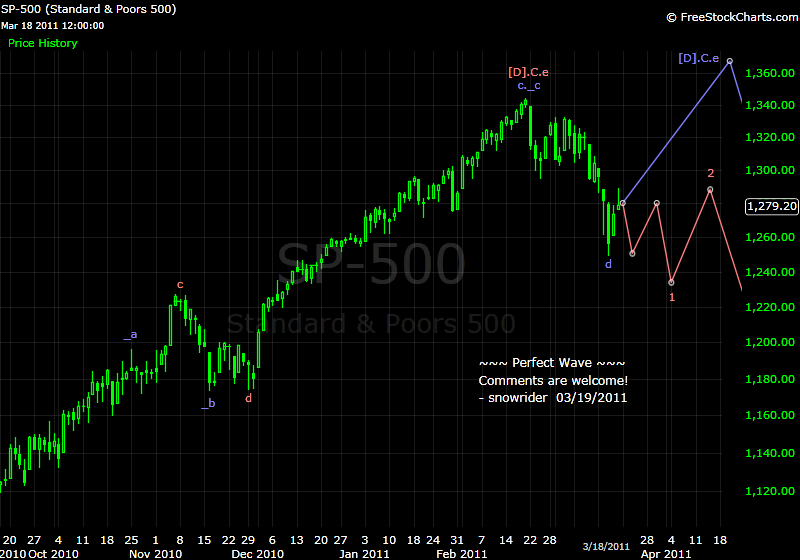
1a2b3cppp - thanks for comments. I post my wave count every weekend when I am less busy, so probably that's why you see the wave counts change from time to time. For each chart, I draw two possible counts - which means two possible market movements in my opinion.
For example, about SP, on 03/12 my counts were either wave-4 was ending (blue line) or a big collapse (wave-3) was going to happen (red line). On 03/19, since a sharp downward movement occurred which voided the wave-4 scenario (because the size of wave), I corrected my counts to either a higher degree of correction (wave-d) was completed (blue line) or the 03/12's red line scenario was still valid.
You can find that some of my wave counts point to the same direction without ambiguity but some don't.