You guys know how modest I am, so I figured I would give my honest explanation of the last few days' action in technical terms.
Forget about memo and interest rates hike, eventually it doesn't matter what triggered the sell off, it has been built into the market for a long time, but specially after the January rally. Simply put, the market went vertical, and anytime when that happens it comes down hard too. It happened to Bitcoin 7 weeks ago, I saw it, I predicted it, and then it happened.
I also so the SPX going vertical specially on the weekly chart, but got a bit complacent about it. After 2 years of relentless rallying, who can blame us? Anyhow, I like to use the spring analogy: The price is like an over stretched spring, and once it is let go, it fluctuates back and forth widely.
I usually use Bollinger Bands to catch market turns, and once a timeframe's BB is penetrated, I switch to a larger time frame. The the market started to fall last week, I was expecting the a hard bounce from the lower line on the daily chart, what was around 2720. When that didn't hold, the weekly frame came to play.
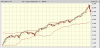
I am showing here the weekly SPX chart. What you can not see is the crazy overnight action of Sunday night. Futures bottomed around 2530, what is really close to the lower BB, and the hard bounce came from there. It is not an exact science, sometimes the price doesn't reach the line, sometimes it penetrates it and then bounces. But overall that is the area where you watch for a change in direction. By the way, the daily chart doesn't show that well the vertical nature of the price action, but the weekly and monthly do.
OK, you say, we got it, over stretched spring, weekly BB, we got. But where do we go from here now? Well, after the bounce the minimum target is the SMA line, what is around 2750. That is where the rally action can get sour and turn back down again. But if that line is cleared, we are looking at touching the upper BB again and a doubletop.
TL,DR: The market went vertical, and what goes up quick, must come down hard, be it crypto or the general market.
Forget about memo and interest rates hike, eventually it doesn't matter what triggered the sell off, it has been built into the market for a long time, but specially after the January rally. Simply put, the market went vertical, and anytime when that happens it comes down hard too. It happened to Bitcoin 7 weeks ago, I saw it, I predicted it, and then it happened.
I also so the SPX going vertical specially on the weekly chart, but got a bit complacent about it. After 2 years of relentless rallying, who can blame us? Anyhow, I like to use the spring analogy: The price is like an over stretched spring, and once it is let go, it fluctuates back and forth widely.
I usually use Bollinger Bands to catch market turns, and once a timeframe's BB is penetrated, I switch to a larger time frame. The the market started to fall last week, I was expecting the a hard bounce from the lower line on the daily chart, what was around 2720. When that didn't hold, the weekly frame came to play.
I am showing here the weekly SPX chart. What you can not see is the crazy overnight action of Sunday night. Futures bottomed around 2530, what is really close to the lower BB, and the hard bounce came from there. It is not an exact science, sometimes the price doesn't reach the line, sometimes it penetrates it and then bounces. But overall that is the area where you watch for a change in direction. By the way, the daily chart doesn't show that well the vertical nature of the price action, but the weekly and monthly do.
OK, you say, we got it, over stretched spring, weekly BB, we got. But where do we go from here now? Well, after the bounce the minimum target is the SMA line, what is around 2750. That is where the rally action can get sour and turn back down again. But if that line is cleared, we are looking at touching the upper BB again and a doubletop.
TL,DR: The market went vertical, and what goes up quick, must come down hard, be it crypto or the general market.