I came across a kind of paradox while trying to calculate the IV of a butterfly strategy.
1) Let’s suppose that we create a 90 / 100 / 110 1-year butterfly using call options and that the IVs of call are 30% / 40% / 50%:

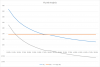
Link to strategy:
http://optioncreator.com/st7wkz0
2) When I tried to calculate the IV of the whole strategy it turned out to be 28% (approximately):

Link to strategy (with IVs set to 28%):
http://optioncreator.com/sti6fv4
You can see than in both cases the value of the butterfly strategy is 1,4 dollars.
The paradox is that the IV of the whole strategy (28%) is smaller than all the individual IVs of options used to build this strategy (30%, 40% and 50%).
Well, I understand that in the butterfly strategy some options were bought and others were sold, but still this may seem somewhat counterintuitive.
The big question is: does the IV of an option strategy make any sense at all? Should we calculate and use this figure?
1) Let’s suppose that we create a 90 / 100 / 110 1-year butterfly using call options and that the IVs of call are 30% / 40% / 50%:
Link to strategy:
http://optioncreator.com/st7wkz0
2) When I tried to calculate the IV of the whole strategy it turned out to be 28% (approximately):
Link to strategy (with IVs set to 28%):
http://optioncreator.com/sti6fv4
You can see than in both cases the value of the butterfly strategy is 1,4 dollars.
The paradox is that the IV of the whole strategy (28%) is smaller than all the individual IVs of options used to build this strategy (30%, 40% and 50%).
Well, I understand that in the butterfly strategy some options were bought and others were sold, but still this may seem somewhat counterintuitive.
The big question is: does the IV of an option strategy make any sense at all? Should we calculate and use this figure?
")