You are using an out of date browser. It may not display this or other websites correctly.
You should upgrade or use an alternative browser.
You should upgrade or use an alternative browser.
Oscillators
- Thread starter Resto
- Start date
Did your triangular rectangular oscillator thing gave you signal to short gold yesterday?
it dropped 300 ticks.
if you shorted it with say 1000 lots, you would have earned $3 million dollars in just half a day !!!
His performance bond requirement on that trade would have been something like $4.5 mil. That's less than a .6:1 reward v. risk ratio. I don't think those triangles take that sort of thing into consideration.
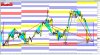
This is the primary price model of the gold price on the 15-minute chart and its volatility
My indicators can only show the direction and volatility, they are not able to take into account the greed of the trader
If you all think like these two trolls, I’m very scared for you gentlemen
My indicators can only show the direction and volatility, they are not able to take into account the greed of the trader
If you all think like these two trolls, I’m very scared for you gentlemen
Attachments
Last edited:
as I said before
#17 Saturday at 12:52 AM
I know exactly how, for example, the pound will work on a 15-minute chart in the next 3 days,
#78 Today at 7:12 AM
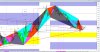
I can only add that the structure of the current triangles has changed a bit, and therefore
further development will be slightly different
As a result, we got the same three triangles
and my pre-calculated volatility is not violated
and again I repeat
I can simply add that for such a clear coordination of the work of technical analysis, any specialist will sell his soul, and such specialists as Williams, Gunn, Elliot, Gartley will suffocate with envy
and I’ll add, Im sure 90% of this site die of envy
Due to the fact that the structure has changed a little, my forecast, which I published earlier, also changed a little.
#17 Saturday at 12:52 AM
I know exactly how, for example, the pound will work on a 15-minute chart in the next 3 days,
#78 Today at 7:12 AM
I can only add that the structure of the current triangles has changed a bit, and therefore
further development will be slightly different
As a result, we got the same three triangles
and my pre-calculated volatility is not violated
and again I repeat
I can simply add that for such a clear coordination of the work of technical analysis, any specialist will sell his soul, and such specialists as Williams, Gunn, Elliot, Gartley will suffocate with envy
and I’ll add, Im sure 90% of this site die of envy
Due to the fact that the structure has changed a little, my forecast, which I published earlier, also changed a little.
Attachments
Last edited:
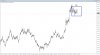
I’m also sure that you yourself know that around the world there is no such specialist who could clearly relate the work of volatility in time
and calculate it a few days in advance
or for example
Like this #58 Monday at 3:13 PM #72 Yesterday at 4:37 AM
It took at least 10 hours and just took a profit
and calculate it a few days in advance
or for example
Like this #58 Monday at 3:13 PM #72 Yesterday at 4:37 AM
It took at least 10 hours and just took a profit
Last edited:
This is the primary price model of the gold price on the 15-minute chart and its volatility
My indicators can only show the direction and volatility, they are not able to take into account the greed of the trader
If you all think like these two trolls, I’m very scared for you gentlemen
his is a typical flat model, and it is no different, for example, from this model. “Random wandering prices”, “White noise” https://www.elitetrader.com/et/threads/random-wandering-prices-white-noise.337498/
I can show thousands of similar models, on different instruments and different timeframes, but I think that if you carefully study the charts, you will understand everything yourself,
Attachments
Last edited:
#1 Oct 13, 2019
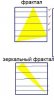
here I said - the price is able to build a limited number of models of only 16,
"create only 8 price models in the development of the upward trend and a similar number of models in a downtrend"
and the work of each triangle is limited by these parameters
having these initial data, I always know where the price will go and what volatility it will have
Look for the points I use and always get good money from trading
Attachments
Last edited: