Any open source options backtesting software (minimal features will do)
https://elitetrader.com/et/threads/...ing-software-minimal-features-will-do.327371/
https://elitetrader.com/et/threads/...ing-software-minimal-features-will-do.327371/
I like to sell options against big moves and way OTM and I like to get the top tick or close to it for the day.
My scheme works OK. On NVDA today (3/24/2022) I got a call off at 1.60 which was top tick for a while until someone sold at 1.66. (4/14 340 Call)
My method as shown in the picture uses an arbitrary Vol Expansion of 15% and an estimated top price of the stock off the chart which works OK.
I know the best way to try and figure the top price is by using vega but I don't know how to estimate the implied
volatility that the option would be if the stock got to the projected price to apply to the current option price at the current stock price.
Any help would be appreciated.
https://www.elitetrader.com/et/threads/day-trading-options.365808/page-4#post-5584122you can try implementing a local volatility model. There are many models around.
The one in the link uses Dupire's formula and (compared to others) is relatively simple.
https://financetrainingcourse.com/education/building-implied-local-volatility-surfaces-excel/
Calendar Spread
Matt says: "An options trade to take advantage of this high IV vs ex earnings IV is a time spread or calendar."Earnings crush is the fall in implied volatility after earnings is announced. Typically, earnings announcements cause the price of the stock to move more than normal. The move will have more effect on short dated expirations since the day of earnings large move has more weight than the rest of the days with normal moves. For this reason, front month expirations will generally have higher IVs than back months. After earnings, the implied volatility falls more in the front months than in the back months for this reason.
There are various measurements to view this effect. Measuring the effect starts with estimating where IV will fall in each of the expirations. This can be accomplished by estimating an earnings effect in each month and varying the effect until the relationship between the IVs make a rational term structure. A rational term structure is where the expirations fit into a smooth curve drawn over time. The term structure is not necessarily a flat as many calculations use. Sometimes the term structure will solve to contango, with a a lower front month, or in backwardation with higher front IVs than back month IVs.
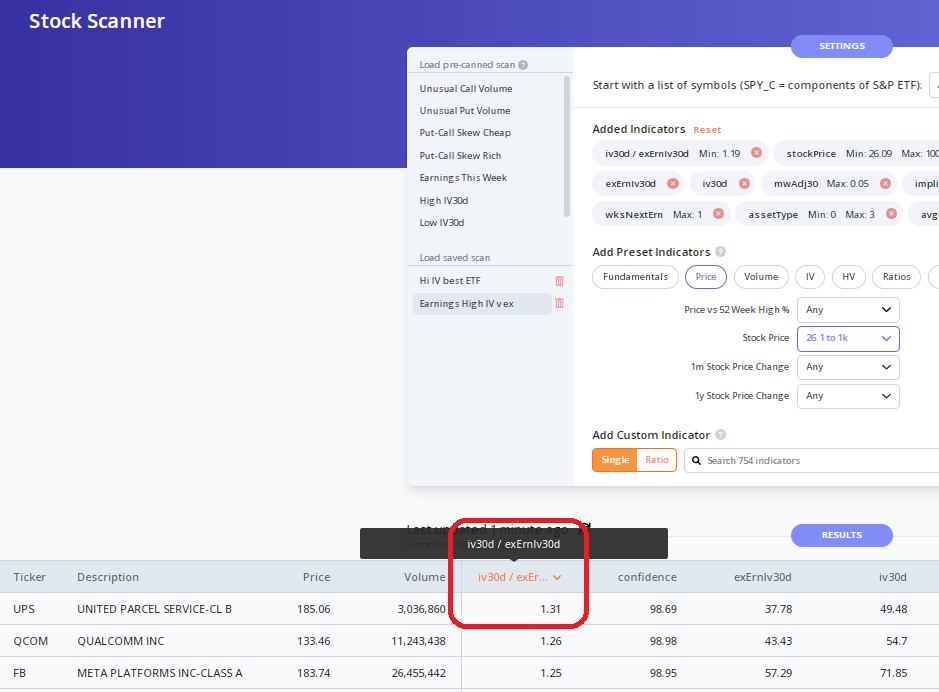
When the part of IV that is the earnings effect is extracted from the raw IV, an ex-earnings IV can be compared. Below is a list of stocks with IV 30 day divided by ex-earnings IV 30 day sorted from highest to lowest.
UPS is the highest ratio at 1.31 with the IV=49.48% and ex earnings IV=37.78%.
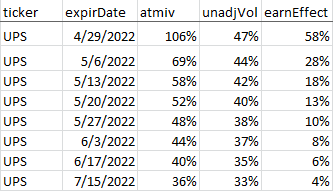
Here's a view of the monthly unadjusted ATM IV for UPS. May 27th is about 30 days out and the IV is 48%. Constructing a rational term structure taking out an earnings effect over the months makes a 38% ex earnings IV for May 27th. The front month of 4/29/22 trading at 106% IV is expected to come down to 47%. The term structure, post earnings is still in backwardwardation.
An options trade to take advantage of this high IV vs ex earnings IV is a time spread or calendar.
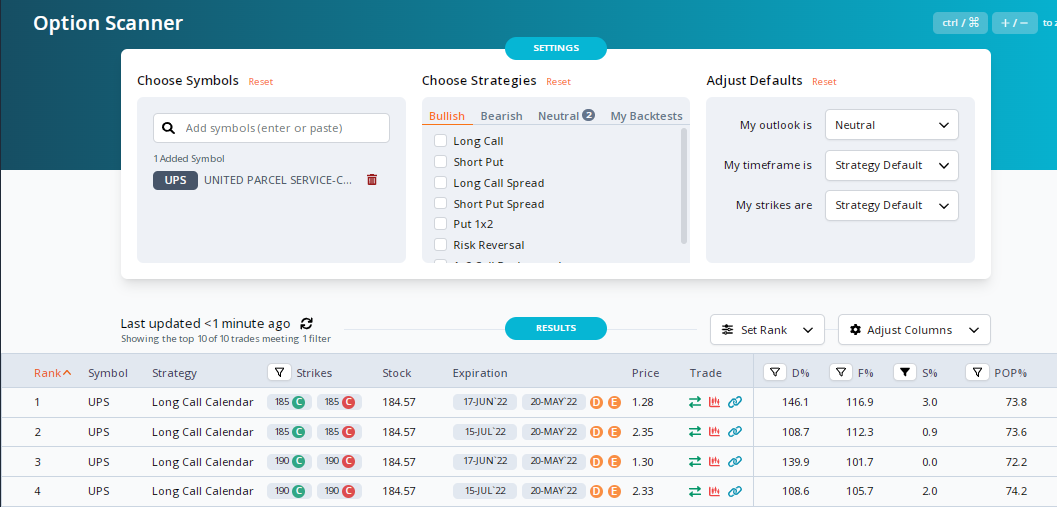
The May-20 June-17 $185 Long Call Calendar has the following profile:
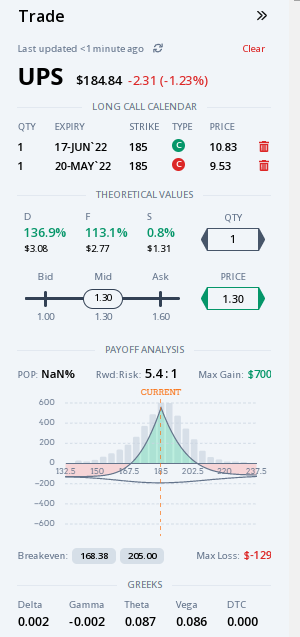
The break even points are estimated at $168.38 -9% and $205 +11%.
The history of UPS moves versus expectations are below:
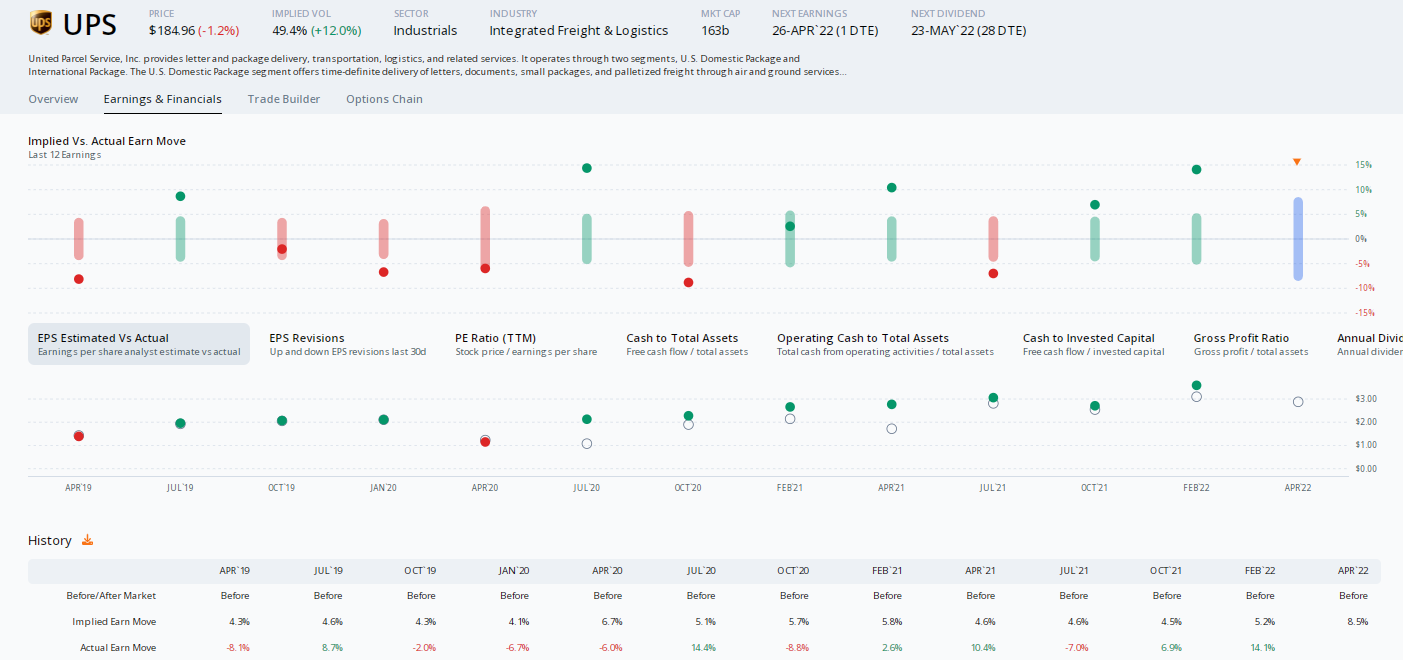
There are two moves of +14% in the last 12 observations but the rest of the earnings moves would probably result in a winning trade.
https://www.elitetrader.com/et/thre...h-long-call-s-and-long-put-s-possible.368085/A synthetic short stock is usually created by using a short call and a long put,
but the question is: can it also be created by using just long call(s) and long put(s)?
Just curious about the maths")
