Skew in options - Search
https://duckduckgo.com/?q=Skew+in+options
Implied volatility surface parameters in options - Search
https://duckduckgo.com/?q=implied+volatility+surface+parameters+in+options
"In options trading, to find an edge, it is useful to
compare implied volatility surface parameters and market values
to forecasted parameters and to theoretical values computed using these parameters."
https://www.elitetrader.com/et/threads/is-skew-cheap-or-expensive.360036/
https://www.orats.com/
Skew in options is the slope of the implied volatility of the strikes in an expiration month. Skew is constantly changing and can affect the value of options and spreads. Risk reversals and wide vertical spreads are among the most affected by changes in skew.
So, how do you know if skew is cheap or expensive?
The first step is to calculate a slope of implied volatility. If you solve for a residual rate that lines up the call and put IVs, calculate good deltas based on a smoothed skew, and plot IV against delta, you will be at a good starting point. Some use other measures than delta that turn out not to be as good at normalizing the skew needed to compare the current skew to related calculations.
Next, calculate a constant maturity slope, like 30 days slope, by weighting the expiration slopes around 30 days.
Next, make comparison calculations for the 30 day slope:
How does the Slope look now for SPY?
- Create a forecast of slope using historical data and linear regressions.
- Take the slope percentile for a year.
- Obtain the slope from the best related ETF and observe the historical ratio of the slopes.
- Calculate the average slope over the past month and year.
- Average the components slope of the best ETF.
Currently, the Slope of the SPY is 9.1 (see 'the smile' below for an explanation). That's the 87th percentile for the year and 8.4% above the forecasted slope of 8.4. The slope divided by the best ETF, in this case IWM, is 1.7 that is near the top of that range. Considering these factors, we can say that the SPY slope appears overvalued. Here’s a graph of these factors.
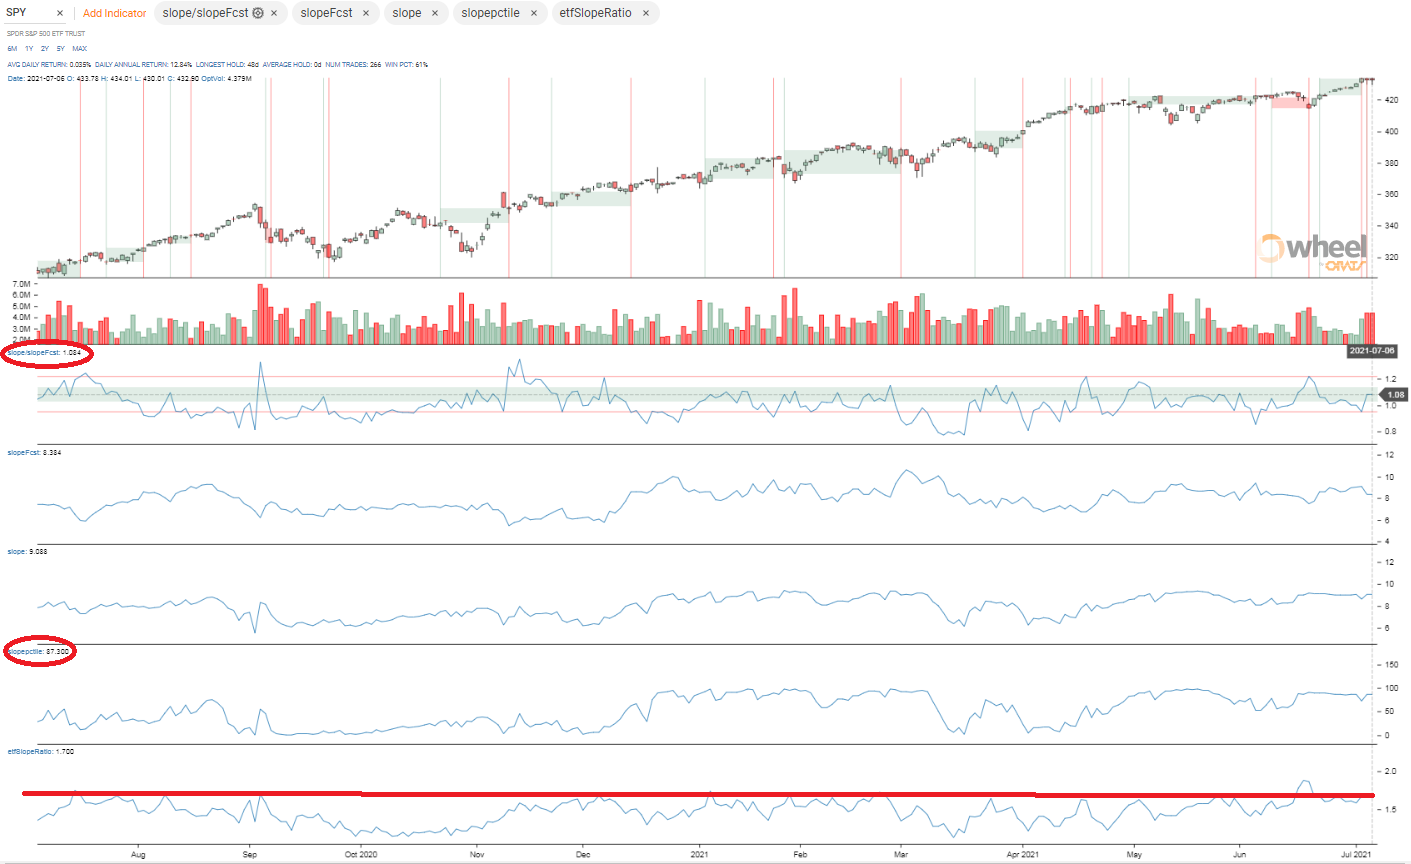
The Chart tab in the Wheel presents these data points historically back to 2007. The documentation and other blogs (search 'slope') explain the various measurements. The data API can be used to get these data too.
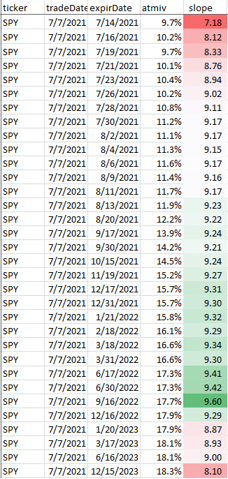
Slopes can be observed in each expiration by using the Monies endpoint of the API. Below is typical: The slope is lower for the near months and greater for the other months. The very far months fall in between.
Slope construction
ORATS describes the implied volatility surface as a 3-dimensional surface where the independent variables are time to expiration, and option delta and the dependent variable is implied volatility. To illustrate an implied volatility surface, we have developed a 2-dimensional graph that displays all three axes in the figure below. Summary information about this surface gives the trader a macro view of the implied volatilities for each option chain. ORATS takes a snapshot of all options on all symbols approximately 14 minutes before the close of trading. Options markets from this time are often of higher quality than at the close.
ORATS measures the surface using the following summary characteristics: at-the-money volatility, strike slope, and derivative (curvature).
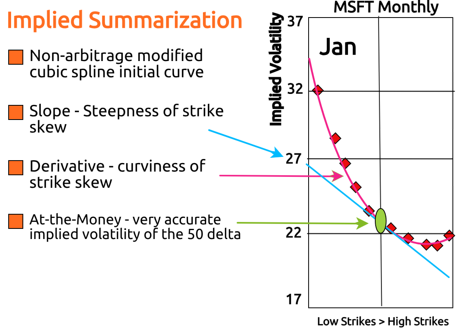
The "Smile"
At-the-money volatility is the implied volatility at the 50 delta call and put. Strike Slope is a measure of the amount that implied volatility changes for every increase of 10 call delta points within the intra-month skew. It measures how lopsided the 'smile' or 'smirk' is. The derivative is a measure of the rate at which the strike slope changes for every increase of 10 call delta points within the intra-month skew. It measures the curvature of the intra-month skew or 'smile.' We chose just two parameters to describe the skew to get a reasonable fit for the fewest assumptions.
Using this method of describing the skew has the additional benefit of producing accurate at-the-money volatility readings important for summarizing the term structure.
#Forecasting the Implied Volatility Surface
These sophisticated methods of summarizing and manipulating the implied volatility surface allow us to compare summary characteristics across related equities and over time. These observations are then used in volatility forecasting models. In options trading, to find an edge, it is useful to compare implied volatility surface parameters and market values to forecasted parameters and to theoretical values computed using these parameters.
More reading...
Last edited: