As of today, 6th of August 2021, the S&P 500 have a high print of 4440,82 - which is a 30,86 % gain from the high in February 2020 last year prior to the Covid dump.
Year to date the S&P500 is up 18,32 %.
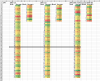
Average yearly gain over the last 21 years (since 2020) is 6,11 % with 2008 and 2002 being outlier years strongly down.
Average yearly gain for the positive years is 15,73 % with the largest 3 years up being 29,60 %, 28,88 % and 26,38%.
Historically and statistically, August and September are the weakest month for the S&P 500 index.
Seeing how we're up more than average already and coupled with seasonal weakness it should not surprise anyone to see at least a pullback from these levels, but I would not simply short the market on that basis alone. Better to wait for a signal, IMO.")

Year to date the S&P500 is up 18,32 %.
Average yearly gain over the last 21 years (since 2020) is 6,11 % with 2008 and 2002 being outlier years strongly down.
Average yearly gain for the positive years is 15,73 % with the largest 3 years up being 29,60 %, 28,88 % and 26,38%.
Historically and statistically, August and September are the weakest month for the S&P 500 index.
Seeing how we're up more than average already and coupled with seasonal weakness it should not surprise anyone to see at least a pullback from these levels, but I would not simply short the market on that basis alone. Better to wait for a signal, IMO.