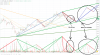
Here is my log for 4/30 along with clean chart of that day. I have no idea how to ID trend types and what actions are required for bar by bar analysis so I'm still looking for the missing pieces. I don't know how Sprout manages to identify EE's... so many!
View attachment 185744
View attachment 185743
An annotated chart and written log go together, they inform each other and are incomplete on their own.
Good job on the log. A couple of things.
There should be 81bars from open to clearing and settlement. So no bar0.
Each bar that gets degapped get logged. Mentally degapping the 5min bar to form the 10 price cases for RTH is like mind gymnastics. Some bars get degapped and others do not, it's important to do it on every bar that requires it as well as track when this happens.
Tracking the bar color of Turns is useful and it'll make trends easier to identify. With trends though, it's a bit like retro. One doesn't quite know until the event happens.
The volume test is marked with "T" for true or "F" for false. The VTP is a series of logical tests repeated in a systematic way.
You need a column for Bookmark between Volume Test and Additional Notes. This column is where you note whether you are Long or Short. Generally, the transition is on a bar and not straddling two bars. L/S - long to short. S/L - short to long.
Bookmarks are placed at Failsafe and A-band EE's, next bar on all other EE's and are helpful at swing highs and lows. Price moving away from a Bookmark is as informative as price penetrating it, penetrating it and closing to invalidate it. The use of Bookmarks are like containing price between two paddle boards. A RTL is usually intersects at a Bookmark. It's helpful to have separate colored BM's.
Additional notes are a good place to track pt1,2,3,ve,ftt's for the three fractal containers.
Your digital log is different than working with a paper log. It might be an issue later, I dunno. The paper log is designed with NLP concepts, so the handwriting is important to influence the mind-body. It's part of the unconscious programming that occurs as one does MADA on each bar. Handwriting grounds it the body and the unconscious serves up what you need when you need it.
With developing practice, what starts to happen are clear moments of 'knowing' what price will mostly likely do and be 'in flow' and carving many turns one right after each other. It's pretty fun!
If you are gonna stick with digital,
There are gestures that are made on the paper log that you'll have to reproduce. It's like a checklist for each bar. Rev Chron and Retro are paper logged a particular way by design, you'll have to reproduce it for your digital version. The gestures help during RTH as well as during debriefing.
Between EE and Action are 3 columns. There are from left to right 30m, 5m and Senti. One is writing S for short and L for long. Senti is for Sentiment of the bar.
Part of your display of market data should be ES 30m, as well as the YM 2m. You can add them if you have capacity. Whatever you need to do to be able to sweep through these screens at various times. I usually have just the 5m as the main focus.
It's normal not to be able to keep up to the the Hard Right Edge with logging. That's ok. It's more important to annotate the price channels and Bookmarks and observe how a bar builds in real time while just broad strokes on the log. The real-time dynamic of how a bar builds is frequently quite different than the artifact of the same bar timestamped on the chart. The lunchtime area of CCC is usually a good time to catch up with the morning. It's like the gym. With more practice, a person will experience an easier and faster ability to ID a bar.
Sometimes it looks like more than one sequence can fit a trend segment.
That's ok, during debriefing, only one will prevail and will "lock in" as the correct ID. It'll just make more sense with WCB and WMCN.
In looking for EE's, Trends are composed of trend segments. The EE's ID all trend segments from the basic granularity on up. What that means is the sometimes the fractal dimensions that are unfolding don't have the same number of bars in their trend segments. The minimum is one bar. Sometimes a single bar goes through a sequence of EE's to it's final transformation.
The Dominants are easier to find and trade then the non-Dom's. I've found semi-automation to work well. That is having a list of all the EE's as drawing templates in my charting package - as well as the 11 sheets binder and examples of all the bar formations in tabular organization. The list of sheets are in the threads you have been working with.
Keep up the good work!
 .
.")