I'll try to be thorough with my comments. These comments will remove the "sometimes" aspect of what you re sensing and processing.
Very good use of terminology. The terminology goes a long ways toward having a consistent logging process.
During any time you are using three nested fractals. The middle fractal is the trading fractal.
Anytime you are in trades and using MADA and annotating and logging. you deal with the fastest fractal first (FFF was the term used for shorthand).
Your comments concern the apparent lack of consistency after ve's. You also comment on WMCN during a ve.
This being the case, I will go thorough the order of events on the table and in doing so, I will remove the "sometimes" by drilling down to give you a "tree" that handles all the branches.
Let me give you the short answer first.
I apologize for past posts that may not have been clear to you. I have difficulty covering all the bases for everyone in any given post.
1. IF you see a VE test it for the zone which is a close on or beyond the original ltl.
2. Examine the next faster fractal pattern and see, if during the bar, the pattern completed. You know you know how to handle a completing pattern on a faster tractal. If there was completion, do the usual regarding the trading fractal which had the VE.
That was the short answer. And it is telling you to trade point to point on the trading fractal from now on. You earned the right by your awareness of doing steps 1 and 2 above.
Lets work further into the scene of WMCN coming into a VE and what happens after a VE.
As usual, volume leads price and this is how "sometimes" gets eliminated.
All VE's or ve's occur after point 3. This means volume has been dominant for a while and it (volume) is telling you something about how all three nested fractals are behaving. Look at you log and size up WMCN on each fractal, particularly with regard to volume and the P's and T's on those three fractals.
You are looking at arriving at a P or going further towards a P in the next few bars. Get the context by looking at the page number of your log. Look at the bar number of your log. Look at the market PACE and determine the contemporary PACE shift going on. This is just my "tuning" you up a little here and there. Context is where "sometimes" came from for you.
Look at the pattern and consider the five volume signals: P, T, P, T, P. Steps 1 and 2 handles the last P only. That is the next faster fractal was "completing".
The LTL is where peaks occur or where VE's occur or soon a peak will occur. So increasing volume is a context for coming to an ltl , going through an ltl and completing a faster fractal pattern.
3. If the volume is peaking at less than the max volume from pt 1 to pt 2 and the volume difference going from the minimum trough @ pt 3 then the trading fractal has also completed its pattern concurrently with the nest faster fractal.
So now you have context and 3 steps for consideration. We now look at the players and who is whom. Spyder has emphasized interbar gausian shifts and they are named IBGS. Here the intrabar context is examined.
As you saw, the zone was examined and you know that you know the prior bar WAS NOT IN THAT ZONE for the first VE occurance. What about when price is operating to make another VE or price is staying in the zone for more than one bar. Look to volume more closely and look at either side of the market: the dominant or the non dominant. You will be surprised, I believe. The "tells" are in how each side is behaving and just who is in the majority and minority.
This is tough to deal with at first but soon the intellect takes charge and "sometimes" goes away simply because you are in one or the other branch of a tree. I am taking you there to the branches so you can then, through experience, take the correct branch on each occasion of branching.
4. If the faster fractal did not complete, then you have to deal with a non dominant leg followed by a dominant leg to get to completion.
5. Toss in a bookmark at the extreme of the VE and watch volume and price work.
6. If you have 4. in play then treat the VE as a new point 2 and the FTT of M1 as the new point 3.
7. Your reversal on the extreme of the VE let you go through the IBGS, if any, on the correct side of the market. A IBGS is a good piece in terms of WMCN to complete a nondominant leg. In point to point trading, you trade M1 and M2. In FTT to FTT trading you sit through M1 and M2 to get the two legs of the faster fractal completed.
In this point I am asking you to get sharpe on volume and how it leads price. I am also asking you to get sharpe on the relative nature of either non dominant or dominant volume.
What you are reading is me going to where you are and opening door after door for you to begin to look through. As you do, you are satisfying a NEED that your mind has notified you that the NEED exists.
So several new pieces, for you, have appeared. you mind is calling each piece a "what". all of these "whats" have places to go to in your mind. They are goi9ng to "where" they want to reside. They will make friends with the pieces already there. They will begin to fit into your already orderly mind. All this collection of pieces is forming a spectrum all orderly according to the work the pieces do for you. The spectrum is called "differentiation".
You have accomplished a lot. Your mind is asking for more pieces so "sometimes" goes away and more "consistency" results from having a tree of paths that contain all the orders of events that can occur according to the system of MADA, the pattern and the interconnections of the nested fractals.
As all these "whats" find "where" the mind will be keeping them, you will notice there is an assembly line going on to build your mind into a differentiated organization. You are, thus, approaching unconscious competence.
Coherence, which you have, is a requirement for building the mind. In contrast, betting, prediction and money and risk management, are incoherent and the mind does not get built. All it does instead is the OODA loop of being like a fighter pilot in a death struggle.
Congratulations.
Trading simply becomes like driving a car when your mind becomes more or less differentiated.
")
")
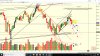
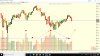
 , leading red volume toward channel RTL, keeping eye out on possible lateral price movements after ve and/or increases in black volume.