Started on weekly chart for PNDORA. Traverses seem to morph into channels in huge sustained moves:
View attachment 175526
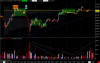
Or like this:
View attachment 175528
The second gives more usable context.
We started with a symbol and chart that you have a personal interest in.
We started here for here you were willing to do work. The method starts where you are.
With that said, both dratsum and tiddlywinks have good comments.
The method's approach to risk management is by the implicit diversification that comes with trading an Index AND/OR by going through the process of scanning for and building a universe of High Quality stocks. Both involve a method of managing risk. Building a Universe of HQ stocks has a long bias. Although stocks that, through the repeating cycles of Acc/Dist, do provide opportunities to short, it's left to the individual trader to apply the necessary adjustments from a firm grasp of the principals. In contrast the PVT method rotates stocks in and out of holding positions as they progress through their Dominant traverses.
Although Pandora's fundamentals could be an opportunity for a LT position (no idea), it's observable PV action would exclude it rather than make it to this list. We know by price action, that this stock does not have eps>90 nor rs>90, both a requirement to make it to this list of high quality stocks. Sometimes due to market conditions the aforementioned parameters are adjusted to screen for a larger set of qualifying stocks. (ie. eps>80, rs>80)
As an educational exercise Pandora is fine but misses other essentials that are also foundational concepts. The goal of this undertaking, aside from the spectrum of differentiation that you are building within your mind, is to make money.
We can make money by not losing money too.
Back to the idea of Failsafes. The first component of a FS is the horizontal lateral boundaries that we draw on the bar before. When price moves directionally opposite of where we were anticipating, XO of this line changes context. This is where tight stops are used in CW. We do not use them the same way. Nor suffer the same effects.
The second component of a FS comes from looking at all the fastest fractal tapes. You will notice the slope of the RTL. Observe the slope of the RTL from a 2 bar combination.
When the slope is steep what does price on the next bar do?
What if when the slope is shallow?
As this two bar tape is drawn, What does the the second bar do in our order of events when volume has
1) incr from the prior bar ?
2) decr from the prior bar ?
3) What happens with price and the RTL on the third bar?
The reference points tiddlywinks has mentioned can be applied to the fastest fractal first.
We do this for we know that all larger trends develop from any two bars we contextualize, accurately and throughly.