The basic aesthetic is to increase clarity with annotations and not have any unnecessary lines that aren't relevant to present price action. (They might become relevant in the future as it comes into now)
Thank you for posting your work.
I miscommunicated, more like this:
View attachment 175141
Ok, I'm happy to share and learn. Coming up with hypothesis and ideas is easy, not so validating them generally.
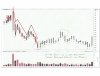
Here's my next attempt, hoping I get the colour right (from volume bar, close-open?):
This next piece is difficult for many to grasp - that this next possibility exists.
We are identifying trend segments that are profit opportunities. This is the standard we are building our minds to allow us to perceive in realtime. We are creating a space in our minds to perceive what comes before a two-bar combo and what comes after. Trends migrate with each successive bar as recycling two bar combos and in the case of laterals, multi-bar combos.
We are cruising through a bunch of concepts, super great! We are taking a high-altitude view, what is unsaid, is that to embody these concepts into the unconscious requires the drills to be done by hand. Hand drawn is better than programming for now.
For all programming is limited by the consciousness of the programmer's own understanding of concepts.
We want to build a sense of muscle memory, so in real time with money on the line, one doesn't stop breathing and get stupidified by the jiggle jiggle of PA.
Like a high-performance athlete, repetition is key. The drills (if done over and over) will get stored into one's LTM and served up at the right moment as "Knowing that you know."
A milestone is to annotate 50 charts in the manner we have described so far as well as keeping a log of questions that naturally arise as one applies the concepts to particular situations.
That can happen simultaneously as we progress the conversation but know that is where the real work lies waiting.
Yes, you can't program anything unless you know what to program, so first you need to program your mind.
Not sure what to find before and after two-bar combos. If it is XB/XR, there's usually some peak or trough associated with it. Maybe easier to read with these lines and should they be adjusted according to volume somehow?