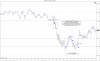
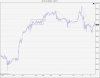
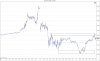
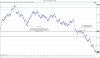
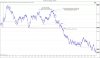
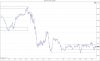
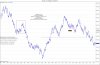
Let's see how many people click on this thread. Going through some testing a "faster" interval alongside my 1min chart. I am on a quest to add more Wyckoffian logic to my trading as well as enter at a "better" price. The attempt is to go with the flow and understand the behavior of those trading the NQ. I have two tested "methods" already that have made some money but I still feel it's a bit based on "pattern recognition."
For example a line break/followed by a RET in a way to the untrained can almost be viewed as a pattern just as a flag or triangle etc. And my blunders before this point are because of that as well as being a rookie and thinking a day like yesterday is going to happen everyday which it does not.
Whatever...not to make this therapy but I've gone back to do some testing with a faster interval viewed as a line. It's not a tick chart but it allows me to see the waves all the while not really losing my "place" like a tick chart did when I made my first attempts observing it move. Yes, it's not the chart choice it's just price movement. I struggled to understand what was going on on the faster charts but that was because I did not give it enough time to start grasping some things. Now...I think I have a better grasp on wtf is going on in front of me. My studies, testing etc of the SLA has been a lifesaver in this regard but I still know there is more. I stumbled upon DB and later the SLA in my search to learn more about Wyckoff. Now that I have some trading under my belt I've gone back to studying Wyckoff. Some things that stick out to me are what he explained as buying on the drive down, getting close to danger points, and being able to close out all longs and go short. This level of understanding is what I seek.
We'll see how much I actually post and some explanations may be "patternesque" but how else can I describe a static chart. Opening up the "1 min chart" and seriously focusing immense attention on it has already opened my eyes to what I was truly after to begin with. I always was interested in the "tape reader" like Wyckoff and Livermore but just couldn't grasp how on earth they did it. I think I get it now and we'll see where this journey takes me.
Also this is not to say the SLA does not work I just crave like I said a better price. Essentially I am looking to start planning/creating a strategy like fortydraws. I've read through all of his posts and his exchanges with DB and at this point after going thru prior testing etc just reading there exchanges makes so much more sense. I have also re-read all 589 pages of the Wyckoff Way thread at TL, re-read/studied both parts of Wyckoff's course, all the if you can threads, game's journal, and DBs book.
This post really hit me like a ton of bricks:
"Think about this activity this way: On the second trade at 77.75, someone bought, and someone sold. The next seller was unable to get a higher price, or even the same price. Demand was not there. Buyers were not willing to keep paying up,. In fact, not only were buyers not willing to pay up, subsequent sellers had to settle for less and less. How many times have you sat there at your screen trying to get that last tick, urging price upward, and finally you threw in the towel and took the lower price? It happens all day long. That is what is happening all over any chart, "inside the bars." The bars don't signal a trade is available, people do.
This is where S/R come in - this activity is taking place all day long all across the range of transactions. But the odds of getting the direction right is only going to tilt in your favor if you wait for those brief moments when price approaches a level that lots of eyeballs are also looking at and ready to do something at.
Now, pull up your own 5 minute chart. Someone who trades 5 minute bars may also have looked at this as a short opportunity. But from what I have read here and at other trading message boards, these traders would be waiting for the break of the low of the 8:06-8:10 five minute bar to enter, or 76. So, you can at least see the advantage of someone trading by price. When the bar trader is getting out on an immediate reaction, my limit order is getting filled if it wasn't filled when the stop was triggered. When the five minute bar trader's breakeven stop is getting filled, I am never in the red for even a tick, as my entry is at least a half point or more higher than the bar trader's."
So again, I don't know how much I'll post but I will post for certain once I have everything finalized. I'll welcome any and all CONSTRUCTIVE comments and criticisms but if you come here and start bashing any of this don't get all butt hurt when I ignore you. This place can be quite negative at times. I am also sort of doing a back test and forward test simultaneously of sorts. It's not really a forward test but more of watching the day that was backtested to get a sense of the flow of it all. What's rough is I've replayed all of 2014 up til now so to replay and trade it via a forward test for the most part I'll have an idea of the outcomes if my memory is good so it wouldn't make sense to "trade it". So I suppose think of it as more of price discovery.
Let's see what I come up with.
For example a line break/followed by a RET in a way to the untrained can almost be viewed as a pattern just as a flag or triangle etc. And my blunders before this point are because of that as well as being a rookie and thinking a day like yesterday is going to happen everyday which it does not.
Whatever...not to make this therapy but I've gone back to do some testing with a faster interval viewed as a line. It's not a tick chart but it allows me to see the waves all the while not really losing my "place" like a tick chart did when I made my first attempts observing it move. Yes, it's not the chart choice it's just price movement. I struggled to understand what was going on on the faster charts but that was because I did not give it enough time to start grasping some things. Now...I think I have a better grasp on wtf is going on in front of me. My studies, testing etc of the SLA has been a lifesaver in this regard but I still know there is more. I stumbled upon DB and later the SLA in my search to learn more about Wyckoff. Now that I have some trading under my belt I've gone back to studying Wyckoff. Some things that stick out to me are what he explained as buying on the drive down, getting close to danger points, and being able to close out all longs and go short. This level of understanding is what I seek.
We'll see how much I actually post and some explanations may be "patternesque" but how else can I describe a static chart. Opening up the "1 min chart" and seriously focusing immense attention on it has already opened my eyes to what I was truly after to begin with. I always was interested in the "tape reader" like Wyckoff and Livermore but just couldn't grasp how on earth they did it. I think I get it now and we'll see where this journey takes me.
Also this is not to say the SLA does not work I just crave like I said a better price. Essentially I am looking to start planning/creating a strategy like fortydraws. I've read through all of his posts and his exchanges with DB and at this point after going thru prior testing etc just reading there exchanges makes so much more sense. I have also re-read all 589 pages of the Wyckoff Way thread at TL, re-read/studied both parts of Wyckoff's course, all the if you can threads, game's journal, and DBs book.
This post really hit me like a ton of bricks:
"Think about this activity this way: On the second trade at 77.75, someone bought, and someone sold. The next seller was unable to get a higher price, or even the same price. Demand was not there. Buyers were not willing to keep paying up,. In fact, not only were buyers not willing to pay up, subsequent sellers had to settle for less and less. How many times have you sat there at your screen trying to get that last tick, urging price upward, and finally you threw in the towel and took the lower price? It happens all day long. That is what is happening all over any chart, "inside the bars." The bars don't signal a trade is available, people do.
This is where S/R come in - this activity is taking place all day long all across the range of transactions. But the odds of getting the direction right is only going to tilt in your favor if you wait for those brief moments when price approaches a level that lots of eyeballs are also looking at and ready to do something at.
Now, pull up your own 5 minute chart. Someone who trades 5 minute bars may also have looked at this as a short opportunity. But from what I have read here and at other trading message boards, these traders would be waiting for the break of the low of the 8:06-8:10 five minute bar to enter, or 76. So, you can at least see the advantage of someone trading by price. When the bar trader is getting out on an immediate reaction, my limit order is getting filled if it wasn't filled when the stop was triggered. When the five minute bar trader's breakeven stop is getting filled, I am never in the red for even a tick, as my entry is at least a half point or more higher than the bar trader's."
So again, I don't know how much I'll post but I will post for certain once I have everything finalized. I'll welcome any and all CONSTRUCTIVE comments and criticisms but if you come here and start bashing any of this don't get all butt hurt when I ignore you. This place can be quite negative at times. I am also sort of doing a back test and forward test simultaneously of sorts. It's not really a forward test but more of watching the day that was backtested to get a sense of the flow of it all. What's rough is I've replayed all of 2014 up til now so to replay and trade it via a forward test for the most part I'll have an idea of the outcomes if my memory is good so it wouldn't make sense to "trade it". So I suppose think of it as more of price discovery.
Let's see what I come up with.
Attachments
Last edited: