Older I get, Less I understand... why is market up when Moore lost, rates likely going higher?

WHY the hell would the DOW be up so much after Moore loses and the Fed is primed to raise rates?!

*
The seasonal influence in effect - this time of year is when the market historically tacks on its largest gains.

* There is no training, classroom or otherwise, that can prepare for trading the last third of a move, whether it's the end of a bull market or the end of a bear market. Paul Tudor Jones


https://seekingalpha.com/article/1183461-seasonal-patterns-in-stock-markets-319-years-of-evidence
 
One things markets do like is paralyzed government. I've made the comparison before to the mid-90s Clinton years when congress was preoccupied by sex scandal and the administration was paralyzed from acting on its own for the same reason. Governments doing nothing means economic stability.

These are not markets moving out of step with the news, this is markets cheering news of ineffectual government.

These are great points. The market is always concerned with government agenda & intervention. The Trump administration poses little threat in this area and has so far proved ineffective when they try to intervene with anything. So it's like a win/ win for the market.

The biggest agenda for the Trump admin is to look good on TV.
 
Guess all these years and wisdom allegedly gained mean nothing anymore when it comes to irrational behavior. WHY the hell would the DOW be up so much after Moore loses and the Fed is primed to raise rates?!

Maybe someone a lot smarter than this older guy can provide a genuine reason for this that I may have overlooked. It would very much be appreciated.

I vividly recall 2000-2001 and where I was when the markets started to crash. I was at El Tovar near the rim of the Grand Canyon watching the bubble burst on a laptop.
But being older now it is possible that THIS TIME really is different after how many years of going up ever yweek? Maybe the Dow never goes lower again or even corrects 5%-10% ! LOL

Anyone notice how much the DOW is up in the past few weeks. Is this in touch with theory, economics and intelligence?! On November 14th it was 23,428 and a few weeks later made a high of 24,699 as I write this. Is that sustainable!!! Is there a precedent for that other than... tulips in Holland?!

At least my 401(k) is performing although I have been exchanging into cash reserves consistently now. Might miss top but not going to particiapte in a large correction or crash like in the early 2000s!

Thanks.
Regards.

I think Republicans are planning to drive this through within 10 days... before the new Senator enters office in January.
 
Some thoughts...

-- Since this current [SPX] upswing can be broadly traced to Jan/Feb 2016, it's pretty hard for rational people to term it a "Trump Rally".

-- "Divided Government" most certainly produces happier markets, going back (empirically) a couple of generations. (Since I'm a nerd: https://en.wikipedia.org/wiki/Bruno_Frey )

-- By not having the 'Bama pajama-ram-a in office, the Republicans have defanged a large Democrat cause. (And its associated distraction.)

-- BUT THE BIG THING (IMNSHO), was the comment on USDollarIndex: we's stronger, and we're going to pay for that (pardon the expression), with higher export prices, and lower profits on 2/3rds of the S&P500. :wtf:

"Ohhhh-hhhhhh!"

Thems my thoughts, anyway.
 
As much as I cringe to admit this, when I pull out the long term logarithmic chart, my 'pivot' above the trend and into a bubble is mid-November 2016.

:D

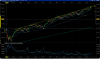
I'll show you mine if you show me yours. :wtf::p (And yes, it's logarithmic.)

SPXDec11pm2yrCapture.PNG
 

Attachments

  • SPXDec11pm2yrCapture.PNG
    SPXDec11pm2yrCapture.PNG
    182 KB · Views: 12
I'll show you mine if you show me yours. :wtf::p (And yes, it's logarithmic.)

View attachment 180261
Slightly longer time frame. :p

history_of_market_corrections2-hires.png


Sorry, this one will have to do. It's linear (my platform doesn't support logarithmic), and I kinda had to approximate the trend line because I can't get data going back far enough. But it makes my point all the same.
dow.jpg
 
Last edited:
And to tie into my previous point about ineffectual government, look at 1994 (Clinton / Lewinsky) and 1924 (Coolidge). It's not a stretch to call either of those predictably ineffectual governments, nor is it a stretch to same the same of a divided republican party, a dunce in the white house, and a nearly evenly split senate that we have currently.

Point is, this is the beginning of a (soon to be much hotter) bull bubble.
 
And to expand on the rational, but unprecedented, bullishness:

At the turn of the 20th century, over the course of a generation, there was a proliferation (or consolidation) of some recent inventions:
-Railroads / Trollies
-Radios
-electric lights
-refrigeration / A/C
-telephones

These inventions changed the way people commuted, traveled, communicated, shopped, entertained themselves...during a single generation. It was a time when consolidation of the railroads allowed for the greatest concentration of wealth ever in human history. Air conditioning (theaters / department stores), refrigeration (groceries, cold beer), and electric lights (night life / theaters...) changed the way people entertained and shopped. Trolleys allowed for the first proto-suburbs. Railroads brought the other side of the nation to the masses in a matter of days, and safely.

Now, consider companies like AAPL, Uber, AMZN, car shares, ULCC airlines...and smart phones. This has been a similar change to the way people commute, travel, communicate, shop, and entertain themselves. It's happened during a single generation. And inventions of the early 2000s have been consolidated in a few companies that that's allowing the greatest concentration of wealth ever in human history.

...seeing a theme here?

It's like Pamplona in July.
 
Slightly longer time frame. :p

history_of_market_corrections2-hires.png


Sorry, this one will have to do. It's linear (my platform doesn't support logarithmic), and I kinda had to approximate the trend line because I can't get data going back far enough. But it makes my point all the same.
View attachment 180265
One thing I always wondered... they always parade these charts of the Dow and S&P showing this slow and steady growth over the last century... thats all well and good...but show me a chart of the Dow 30 or the S&P with the original components.

If a company under-performs.... it gets the boot. Pretty easy to engineer an ever rising index when you can just kick the losers out at will.

But whadda I know.
 
Back
Top