Observations (an example)

Status
Not open for further replies.
the market was in a distribution phase where strong hands were the ones offering supply. IMO, the signs started soon after 9:46 or so. It was very easy to track, if, as you say, DbPhoenix, you know what you are looking for.

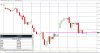
Quick question... do you mean 9:46 ET? I hope you don't mind me throwing in my chart here, but at 946 ET (Its 846 on my chart since I use the exchange time which is of course Chicago time), the trend up is still looking good. An hour later of course ...

Yes, 9:46 EST. The signs started around there. Yes, the trend was still up for the day. So the question for you (or anyone attempting to learn to trade by price) to ask yourself is what could possibly be signs of high quality supply selling to poor quality demand. The idea is to recognize what is going on so that when the down turn comes an hour later we are not surprised ... by anything.

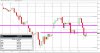
Here is my S/R prep from last night.

index.php


And here it is at the end of the day. Note the level at which today's high failed. Note also the level price happened to be at when the bell rang. Now, that is mere coincidence that it opened at the midpoint of the entire decline form the December high. But having opened there, and trading immediately higher, then the level for a trade likewise was not a surprise. Recognizing that sellers were taking control in spite of that nearly 80+ point rally from yesterday's NY close, none of what came after should have been a surprise. You just follow the story to the end. An unexpected act of terror or war is a surprise. Traders doing what traders do is simply a matter of course.

index.php


I'll not be trading tomorrow, or the rest of the week, but I will still clean up my S/R prep chart as though I were trading, and I will post that here tonight.
 

Attachments

  • For Trading on 2015-01-13 reduced.JPG
    For Trading on 2015-01-13 reduced.JPG
    154.6 KB · Views: 463
  • For Trading on 2015-01-13 EOD reduced.JPG
    For Trading on 2015-01-13 EOD reduced.JPG
    157.4 KB · Views: 499
Yes, 9:46 EST. The signs started around there. Yes, the trend was still up for the day. So the question for you (or anyone attempting to learn to trade by price) to ask yourself is what could possibly be signs of high quality supply selling to poor quality demand. The idea is to recognize what is going on so that when the down turn comes an hour later we are not surprised ... by anything.

And here it is at the end of the day. Note the level at which today's high failed. Note also the level price happened to be at when the bell rang. Now, that is mere coincidence that it opened at the midpoint of the entire decline form the December high. But having opened there, and trading immediately higher, then the level for a trade likewise was not a surprise. Recognizing that sellers were taking control in spite of that nearly 80+ point rally from yesterday's NY close, none of what came after should have been a surprise. You just follow the story to the end. An unexpected act of terror or war is a surprise. Traders doing what traders do is simply a matter of course.

I'll not be trading tomorrow, or the rest of the week, but I will still clean up my S/R prep chart as though I were trading, and I will post that here tonight.

So the question for you (or anyone attempting to learn to trade by price) to ask yourself is what could possibly be signs of high quality supply selling to poor quality demand.

Gosh.. this is a tough one. As you say, we opened at the 50% level, so when we went up, this was bullish since we were able to retrace past the 50% of the down move. At the same time, we have that swing high from 2 days ago at 4252 to clear. We got to within 4 points and ran out of buyers.. pretty damn close. But at 9:46, when we were still at just below 4240, and still making HH's and HL's, I'm not even sure how to begin to evaluate the quality of the buyers.

For me, when at 10:00 we hit a high of 4245 and settled into the range, that is the first sign of a pause. The attempt to go higher at 10:50 that failed at 4247 and brought us back into the range was another clue. But still no reason to suspect going down. After all, just because we couldn't penetrate that swing high from two days ago at 4252 doesn't mean we can't. All we can say is that during the time that price spent in that range, buyers weren't motivated enough yet or didn't have enough help. Then at 1130, after we dropped below and failed to recover past the midpoint of that range was it becoming clear that the LOLR was down... but its still a shocker to think that at 0946 you saw the quality of supply being higher than the quality of demand. So if you get a few minutes when you post your charts tonight... I'm all ears (or eyes!)

Looking forward to your charts!
 
So the question for you (or anyone attempting to learn to trade by price) to ask yourself is what could possibly be signs of high quality supply selling to poor quality demand.

Gosh.. this is a tough one!

I didn't mean for you to answer it here. I mean for you to take it back to your journal and get to work. Less talk, more think. Thoughtful observation.
 
I didn't mean for you to answer it here. I mean for you to take it back to your journal and get to work. Less talk, more think. Thoughtful observation.
I am thoroughly enjoying observation... but I cheated by asking Db for his insight about quality! :D
 
What, if anything, might one infer from this? Looks like there is still a bit of demand here at these levels, and it may be of decent quality. Note how these are patient buyers buying the sell stops of impatient sellers ... or weaker longs.

Journal 31.JPG
 
Last edited:
Interesting ... certainly makes that low and the demand line tracking price from the low of the day levels that bear watching if revisited.
Journal 32.JPG


Journal 34.JPG

Broke the low of day by 5 points and now it seems as though demand has again started to materialize as the market heads into the close of the NY session.
 
Status
Not open for further replies.
Back
Top