Another interesting chart..
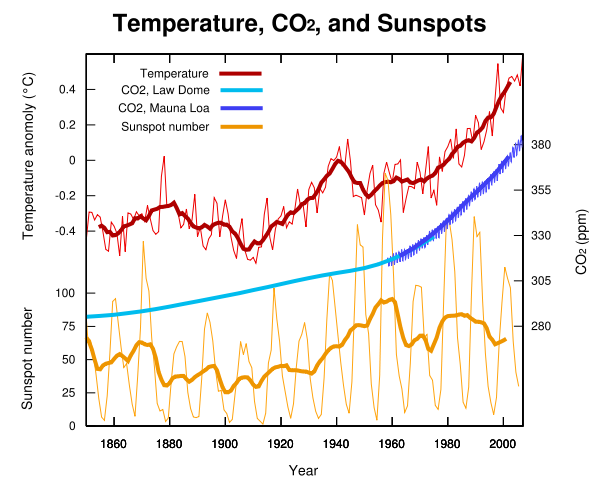

Quote from futurecurrents:
What does warming outside of natural variability even mean? Sounds like your typical doublespeak.
Has it been hotter? Yes. Colder? Yes.
The rate of rise is the important thing and the rate is unnatural.

Oh look. It looks like a hockey stick!

Quote from jem:
how about a recent chart... this is what the red line looks like now and it seems to match up with the sun a lot more than co2.
co2 closely lags the change in ocean temp.

Quote from futurecurrents:
Interesting, after looking at this chart, scrolling up from the temp spikes...
Nearly every major spike in temp is coincident with the seasonal high CO2 levels, providing good evidence that CO2 levels determine temperature.
Excellent example of temp determination by CO2 level.


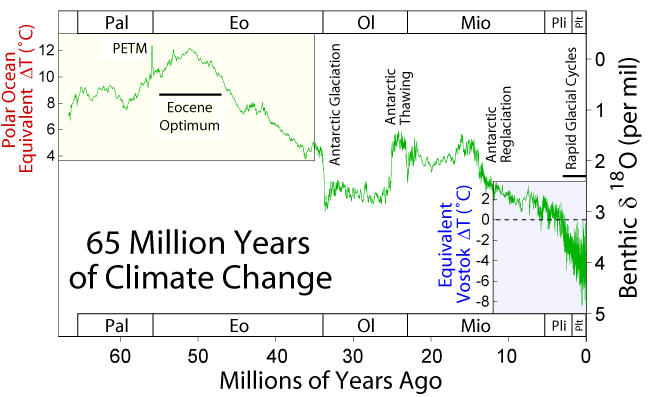
Quote from futurecurrents:
Temperature data from four international science institutions. All show rapid warming in the past few decades and that the last decade has been the warmest on record.
Quote from jem:
lie much? why misrepresent what you can see on a chart when you can just review the data as the scientists do who wrote the paper we linked to a few days ago on this thread.
there it was shown that ocean and air temps lead co2 by 9 to 12 months.