
You are using an out of date browser. It may not display this or other websites correctly.
You should upgrade or use an alternative browser.
You should upgrade or use an alternative browser.
Not 97% but .3% of Climatologists agree.
- Thread starter jem
- Start date
"carbon dioxide accounts for about 20 percent of the greenhouse effect, water vapor and clouds together account for 75 percent, and minor gases and aerosols make up the remaining five percent. However, it is the 25 percent non-condensing greenhouse gas component, which includes carbon dioxide, that is the key factor in sustaining Earthâs greenhouse effect.
By this accounting, carbon dioxide is responsible for 80 percent of the radiative forcing that sustains the Earthâs greenhouse effect."
http://www.nasa.gov/topics/earth/features/co2-temperature.html
By this accounting, carbon dioxide is responsible for 80 percent of the radiative forcing that sustains the Earthâs greenhouse effect."
http://www.nasa.gov/topics/earth/features/co2-temperature.html

another bullshit model. (I do not have a problem with modeling but lets not pretend its proven theory. )
from your link.
http://www.nasa.gov/topics/earth/features/co2-temperature.html
"Our climate modeling simulation should be viewed as an experiment in atmospheric physics, illustrating a cause and effect problem which allowed us to gain a better understanding of the working mechanics of Earthâs greenhouse effect, and enabled us to demonstrate the direct relationship that exists between rising atmospheric carbon dioxide and rising global temperature," Lacis said.
from your link.
http://www.nasa.gov/topics/earth/features/co2-temperature.html
"Our climate modeling simulation should be viewed as an experiment in atmospheric physics, illustrating a cause and effect problem which allowed us to gain a better understanding of the working mechanics of Earthâs greenhouse effect, and enabled us to demonstrate the direct relationship that exists between rising atmospheric carbon dioxide and rising global temperature," Lacis said.
Quote from futurecurrents:
"carbon dioxide accounts for about 20 percent of the greenhouse effect, water vapor and clouds together account for 75 percent, and minor gases and aerosols make up the remaining five percent. However, it is the 25 percent non-condensing greenhouse gas component, which includes carbon dioxide, that is the key factor in sustaining Earthâs greenhouse effect.
By this accounting, carbon dioxide is responsible for 80 percent of the radiative forcing that sustains the Earthâs greenhouse effect."
http://www.nasa.gov/topics/earth/features/co2-temperature.html
Good thinking, there is lots of O2 and even more N2 by comparison with CO2, so that's good thinking. However, neither O2 nor N2 are present in fc's IR radiance chart that i tacked on below. They have the first requirement for a good GH gas, transparency to visible light, but not the second requirement, partial opaqueness to ir. They just let IR go right through them. *Well O2 has a spike absorbance in the vis-ir transition region, but it is due to something other than an ir active vibrational mode. (I think it must have a very low energy electronic transition available because it is a groundstate di-radical. We'll have to ask the photo physicists.)Quote from Lucrum:
it's necessary for photosynthesis. You know, oxygen. 21% of the atmosphere.

Here is what the emr coming from the sun looks like. This is the official spectrum that the guys that make solar photovoltaics use.
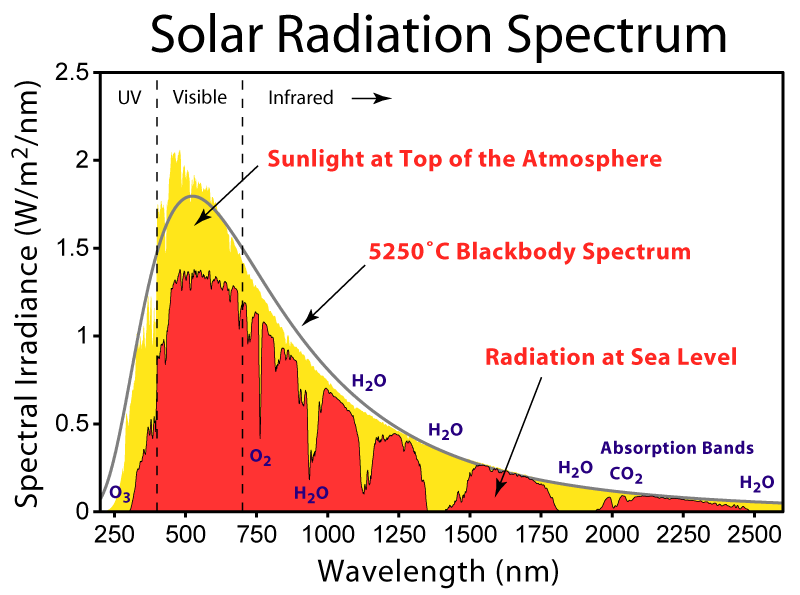
The yellow is the spectrum coming from the sun as experience by our outermost atmosphere. It is nearly a continuum because the thermal temperature is so high. The dark line is what the theoretical continuum, Planck, Black body radiation would look like for a body at 5533 deg Kelvin. We can see immediately that the sun closely approximates a black body radiator.
The orange is what gets through to us. That little bit of uv starting to sneak in about 275 nm up to about 350 nm is what causes sunburn (Thank goodness for O3). Notice that about 3/4s of the visible gets through (about a 1/4 is taken out by rayleigh scattering, etc), and then when we get into the ir region (where most of the solar irradiance lies), we start to see chunks of the irradiance absorbed by various components of the atmosphere. We see that water vapor is the most important absorber, and then comes CO2 which takes out a little. Some of the other gases are much better ir absorbers than either water or CO2, but there just isn't enough of them to have much of an impact. Notice that Water is effective at quite short wavelength ir (it apparently has some quite energetic stretching modes available).
Now in this solar spectrum you are NOT looking at the green house effect. You are looking at one of the two necessary properties of greenhouse gases, viz. the ability to absorb emr in the ir region.
Let me make what I think is a very important point and that is that GW and AGW are two separate topics. GW is determined by direct measurement, but the AGW question is a separate and more complex issue not easily resolved. We have been asking the AGW question for more than 30 years, but only in the last decade or so have we made any real progress. We may have fallen for the post hoc fallacy, which in brief is this: If B happens after A than A must have caused B. I'm sure we will eventually know whether or not we have once again been victims of the post hoc fallacy.
Note the solar irradiance chart stops in the near ir, 2500 nm = 4000 cm<sup>-1</sup>. So unfortunately the charts don't show the same spectral regions. I'll look for a solar irradiance chart that goes further out.

Another way we can see the effects of GHG's is by measuring the upward radiation leaving earth.
The following chart shows the reduction in radiation leaving the earth during the period 1970 to 1996. As the levels of GHG's have gone up there has been reduction of IR at the wavelengths associated with the various GHG's
This reduction of outgoing radiation has resulted in the warming of the earth over that period. As if a blanket has gotten thicker or a greenhouse more glass.
This is further empirical evidence of the increasing warming effect of the increasing GHG's of which CO2 is one.

The following chart shows the reduction in radiation leaving the earth during the period 1970 to 1996. As the levels of GHG's have gone up there has been reduction of IR at the wavelengths associated with the various GHG's
This reduction of outgoing radiation has resulted in the warming of the earth over that period. As if a blanket has gotten thicker or a greenhouse more glass.
This is further empirical evidence of the increasing warming effect of the increasing GHG's of which CO2 is one.
I just realized that I might have confused a lot of folks by putting up charts of two different spectral regions that don't overlap. The important property of the green house gases you are looking at in the solar spectrum i posted is their transparency to visible light. You are also seeing where these gases absorb in the region of direct solar irradiance, but that absorbtion is not very important as far as the green house effect goes. The GH house effect involves ir absorbance by the GH gases of ir emitted from the Earths surface, and that emission occurs at much lower energies than does the direct solar irradiance. If you could extend the solar spectrum way out to the right you'd get into the region covered by the regular ir region encompassed by fc's plot which shows the absorbance of CO2 in that region. Water is not shown in the fc chart because its main absorbance is at higher energies (further to the right in the fc chart) between 3000 and 4000 wave numbers. It falls in the "crack" between the two charts!
What we really need is the solar irradiance spectrum, the ir emission spectrum from the Earths surface, and the 4000-400 wavenumber absorbance spectrum for the gases. Then we would have the complete picture.
To confuse you even more, the solar spectrum has energy decreasing from left to right, whereas the fc spectrum has energy increasing from left to right. It would be nice to have them both in nm. I was told that the reason ir spectrosopists like to use wavenumbers is because that's the way molecules think! Wave numbers are directly proportional to frequency, which is in turn directly proportional to energy. (Actually the real reason ir spectra people use wave numbers is because they get conveniently sized integers on the x-axis without having to use exponential notation.)
What we really need is the solar irradiance spectrum, the ir emission spectrum from the Earths surface, and the 4000-400 wavenumber absorbance spectrum for the gases. Then we would have the complete picture.
To confuse you even more, the solar spectrum has energy decreasing from left to right, whereas the fc spectrum has energy increasing from left to right. It would be nice to have them both in nm. I was told that the reason ir spectrosopists like to use wavenumbers is because that's the way molecules think! Wave numbers are directly proportional to frequency, which is in turn directly proportional to energy. (Actually the real reason ir spectra people use wave numbers is because they get conveniently sized integers on the x-axis without having to use exponential notation.)
Piezoe, my first chart has the water vapor filtered out to better show the other GHG's.
https://ams.confex.com/ams/Annual2006/techprogram/paper_100737.htm
https://ams.confex.com/ams/Annual2006/techprogram/paper_100737.htm