Someone decided to turn that brainwashing machine on.The TV in most peoples' homes is on all day long.
In nazi germany they gave free TVs...
Last edited:
Someone decided to turn that brainwashing machine on.The TV in most peoples' homes is on all day long.
So we're in the period following a devastating war that the U.S. lost and the U.S. is subjected to punishing reparation payments like the Weimar Republic? Or did you just pick a historically bad case of inflation that has absolutely nothing in common with the current situation and throw it in because ????Lessoned learned from the Weimar Republic
A couple of thoughts on that. First off, "cumulative inflation" is a pretty deceptive chart to show. Let's take a look at this more relevant chart of actual inflation by year:First 150 years of United States had no or very slow inflation overall:
View attachment 255162
Very valuable historical precedent as it proves that sound money has indeed worked in practice, contrary to all speculative arguments of why it couldn't.
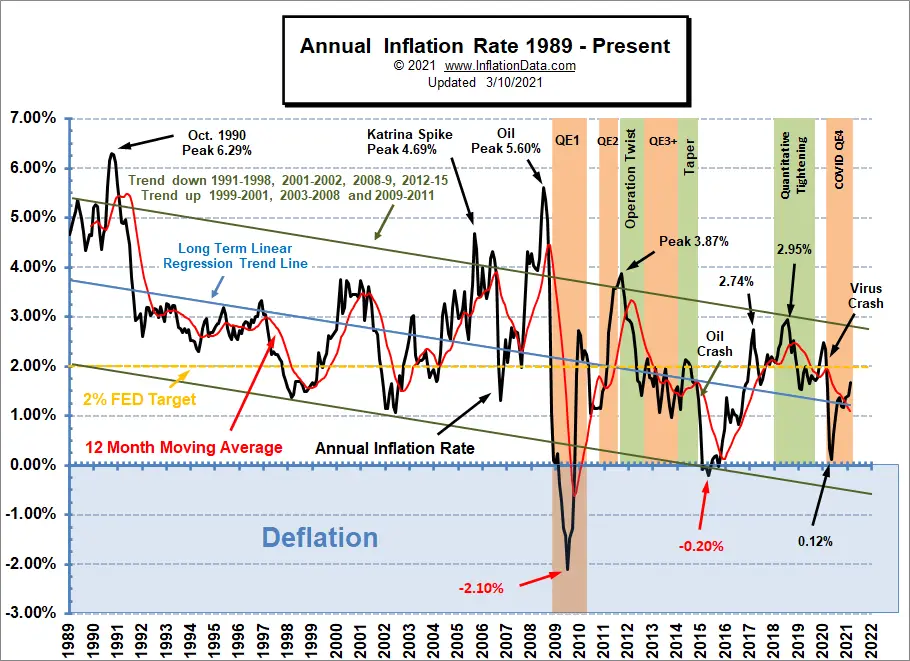

Not in the chart below.Hmm, looks like inflation is on a definite downtrend over the last nearly half century to me, how about you?
Complete stagnation? Let's work this out. Real GDP per capita (2012 dollars) wasWow, looks like that period of low inflation you're so proud of also led to complete stagnation of our productivity and wealth.
So you've got no problem using the cumulative graph but mine isn't valid? Gotcha. Not sure where you got your numbers because they don't match what I found, but for arguments sake let's use them. The time period you apparently think of as superior to our time period grew at a rate that was 33% lower than the time period you seem to think is bad! That's good? Something we should want to go back to?Not in the chart below.
Complete stagnation? Let's work this out. Real GDP per capita (2012 dollars) was
$1,800 in 1789
$10,000 in 1919
$49,000 in 2009
So far, that's a CAGR of 1.33% for the first 130 years vs. 1.78% for the next 90 years.
However, the official CPI methodology has been changed several times such that the index reads vastly lower post 1980. Source: www.shadowstats.com/alternate_data/inflation-charts
Correct for the CPI manipulation and real growth rates per capita aren't materially different pre and post 1919.
View attachment 255183
Attached is the exact source of data I used, gdp_current_real_per-capita_1789-2012.pdf. Which is the same as yours, Economic History at www.eh.net. Only difference is mine is inflation adjusted to 2012 dollars, yours was 2000 dollars.Not sure where you got your numbers because they don't match what I found,
The problem is you're showing real GDP growth on a linear scale. Assuming the growth is an exponential function, you'd make more sense using a log scale. Even when adjusted to 2012 buying power, growth of $1,000 in 2012 is far less significant than growth of $1,000 in 1800.Once again, are you seriously saying the left hand side of the chart is better than the right hand side?
The thing is that the official U.S. government methodology of calculating the CPI has changed over the years. Using the old U.S. government methodology that was current in the 1980s, today's inflation rate is vastly different.Could you point to just one specific item in the current CPI handbook
So we're in the period following a devastating war that the U.S. lost and the U.S. is subjected to punishing reparation payments like the Weimar Republic? Or did you just pick a historically bad case of inflation that has absolutely nothing in common with the current situation and throw it in because ????